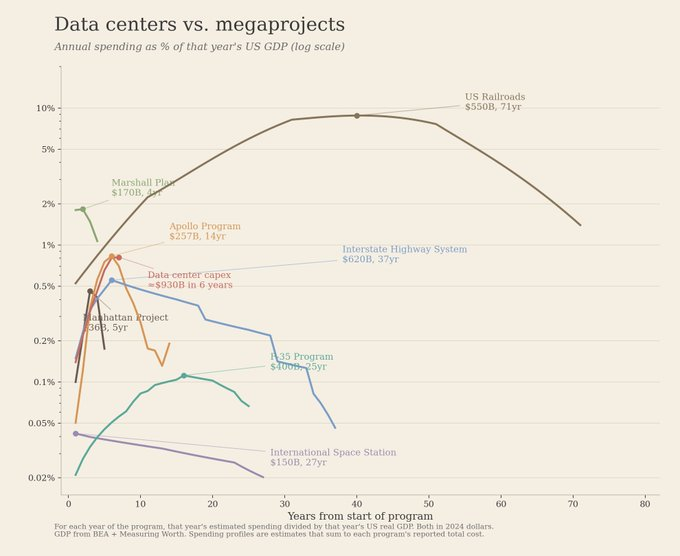
Second chart that takes into account GDP, which makes it much more realistic
https://files.mastodon.social/media_attachments/files/116/423/019/462/451/025/original/b68ea00e34682db5.png
Damn, I fell for graph 1) again. Turns out that data centre capex actually isn't all that unusual?
GNU social JP is a social network, courtesy of GNU social JP管理人. It runs on GNU social, version 2.0.2-dev, available under the GNU Affero General Public License.
![]() All GNU social JP content and data are available under the Creative Commons Attribution 3.0 license.
All GNU social JP content and data are available under the Creative Commons Attribution 3.0 license.