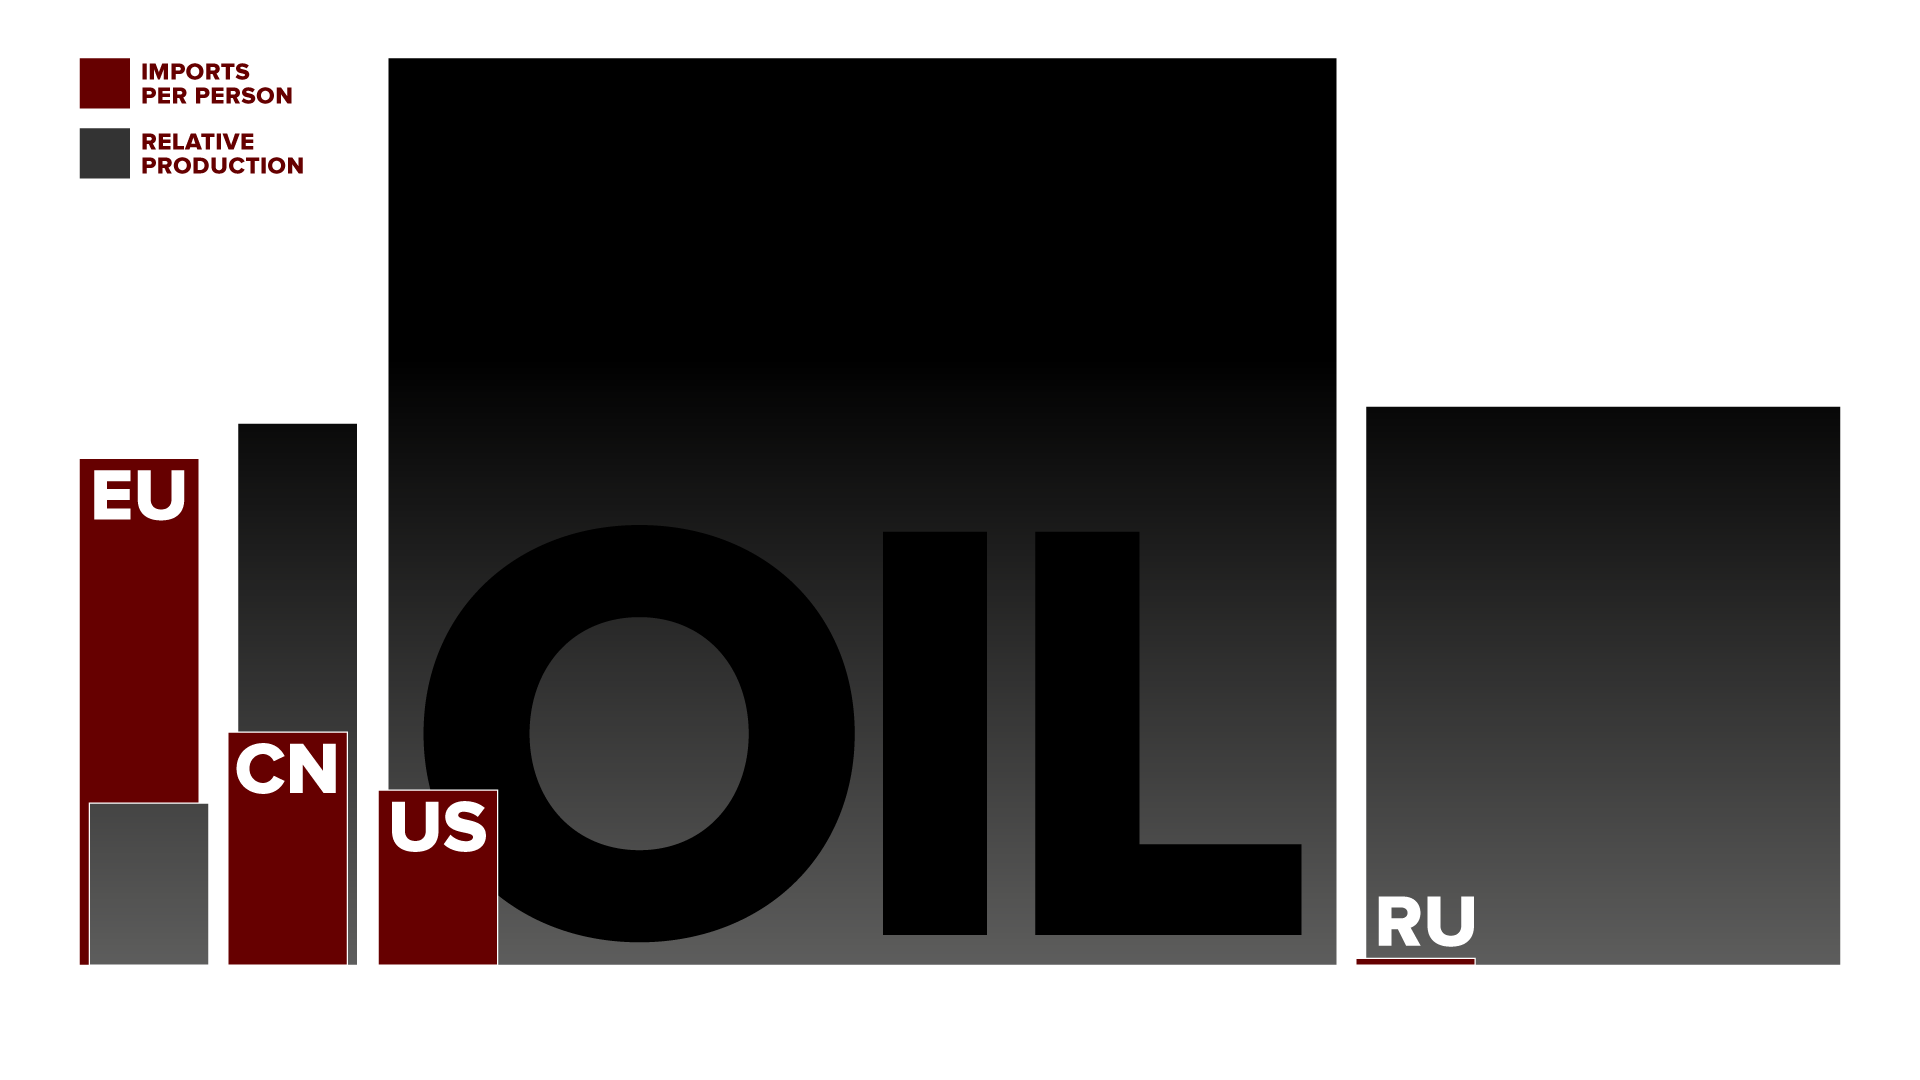
Area chart of the figures given. For each of the 4 regions, oil imports are represented in dark red, with relative production in dark grey.
https://files.mastodon.social/media_attachments/files/114/235/000/253/886/342/original/e46af1b8bbe06cda.png
#eupol
A rough guide to the intensity of the *dependency on others* for oil:
Europe:
6.1 barrels imported per year per person (bipypp)
~314% of own production (exc. Russia and Caucasus)
China:
2.8 bipypp
42.9% of own production
USA:
2.1 bipypp
2.4% of own production
Russia:
0.07 bipypp
0.3% of own production
Use this to sense check your politicians
- Riffing on: https://mastodon.social/@urlyman/114233968625224293
- Europe (not EU): https://mastodon.social/@urlyman/114116524153006437
- Further notes: https://mastodon.social/@urlyman/114235045724857385
GNU social JP is a social network, courtesy of GNU social JP管理人. It runs on GNU social, version 2.0.2-dev, available under the GNU Affero General Public License.
![]() All GNU social JP content and data are available under the Creative Commons Attribution 3.0 license.
All GNU social JP content and data are available under the Creative Commons Attribution 3.0 license.