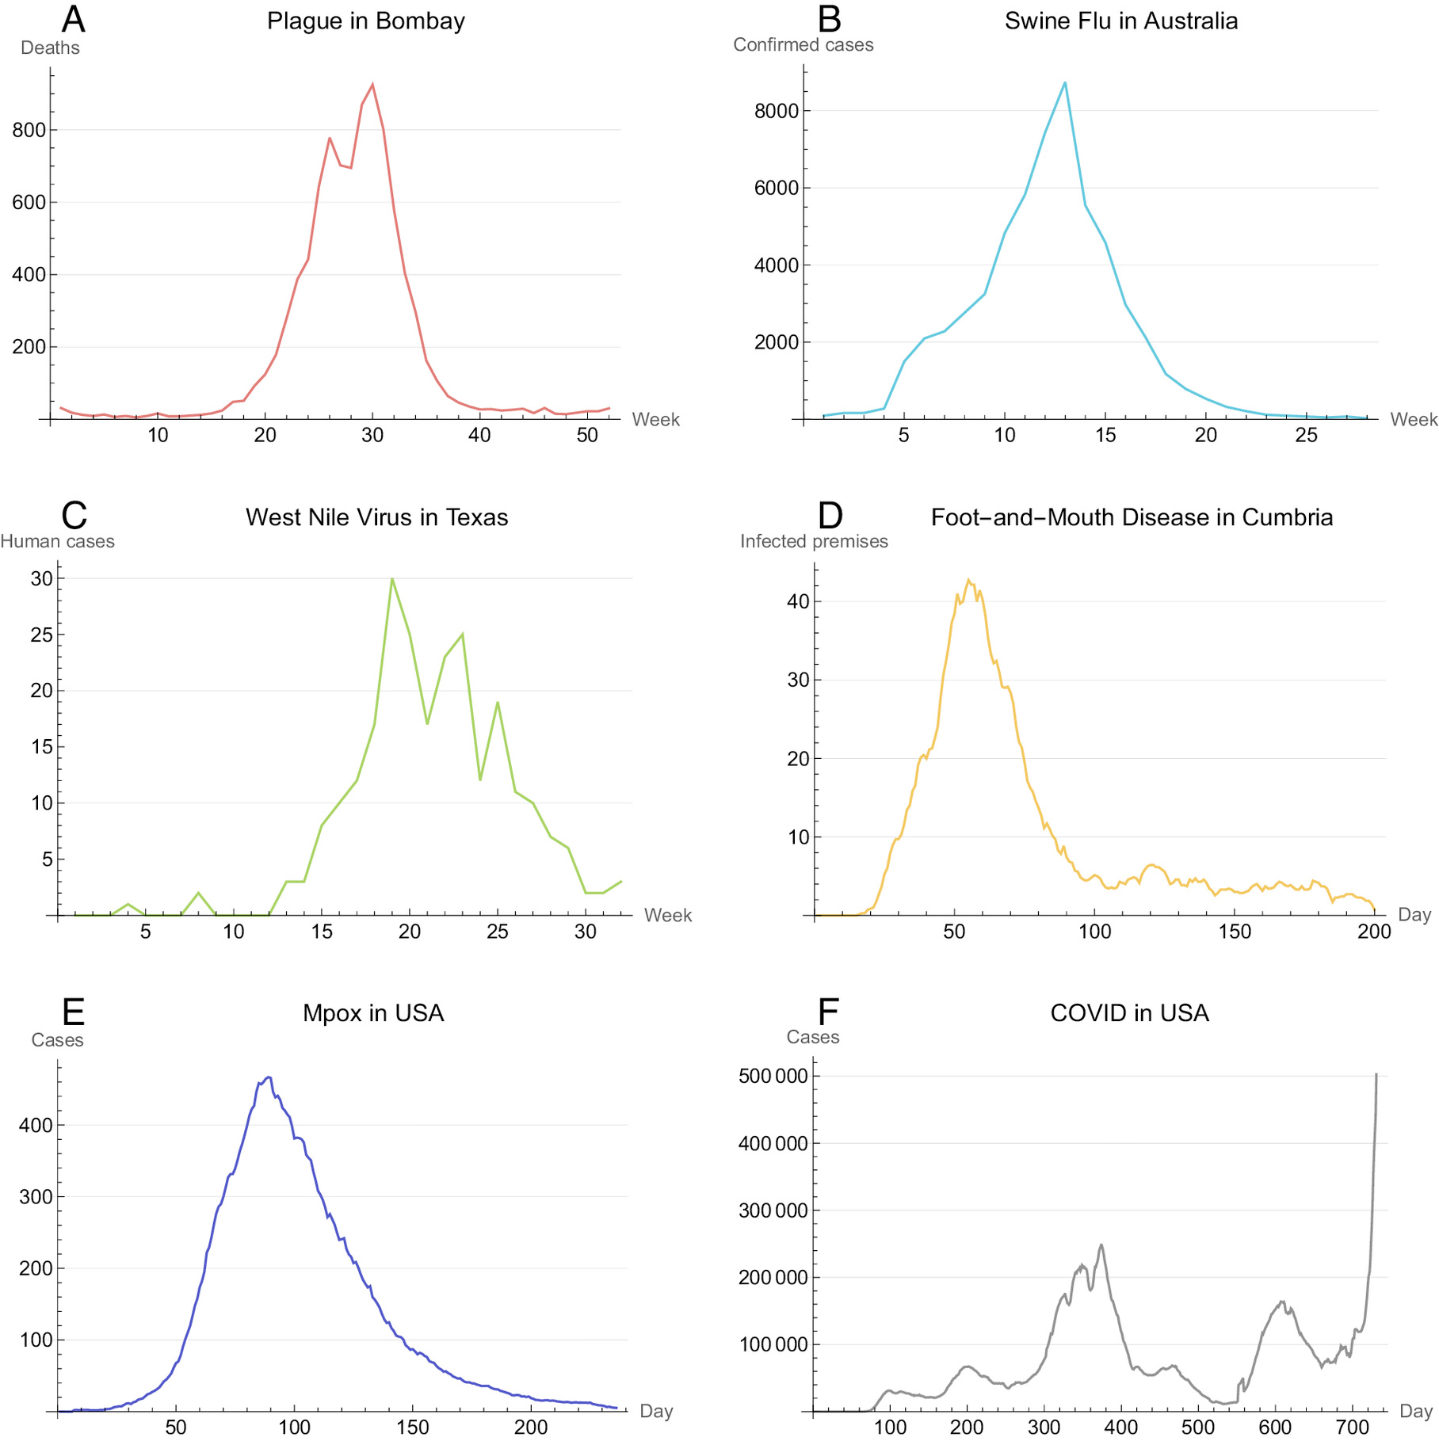
Fig. 1. Epidemic curves for six disease outbreaks. Even when assessed at different levels of granularity, most (A–E) share a common form. The COVID-19 pandemic (F ) had a very different trajectory. (A) Plague deaths in Bombay 1905 to 1906, from ref. 7, as used in the 1927 paper that introduced SIR modeling (4). (B) Swine Flu cases in Australia, 2009. Data extracted from figure 4 in ref. 8. (C) Premises with livestock infected with foot and mouth disease in Cumbria, 2001, rolling 7-d average from ref. 9. (D) Human cases of West Nile Virus in Texas May to December 2015, data from Texas Department of State Health Services. (E) Mpox cases in the USA, May 10 to December 31, 2022, data from CDC. (F ) COVID-19 in the USA 2020 to 2021, rolling 7-d average with data from the World Health Organization.
https://fediscience.org/system/media_attachments/files/111/654/587/881/278/975/original/63fb62097260bbbe.png