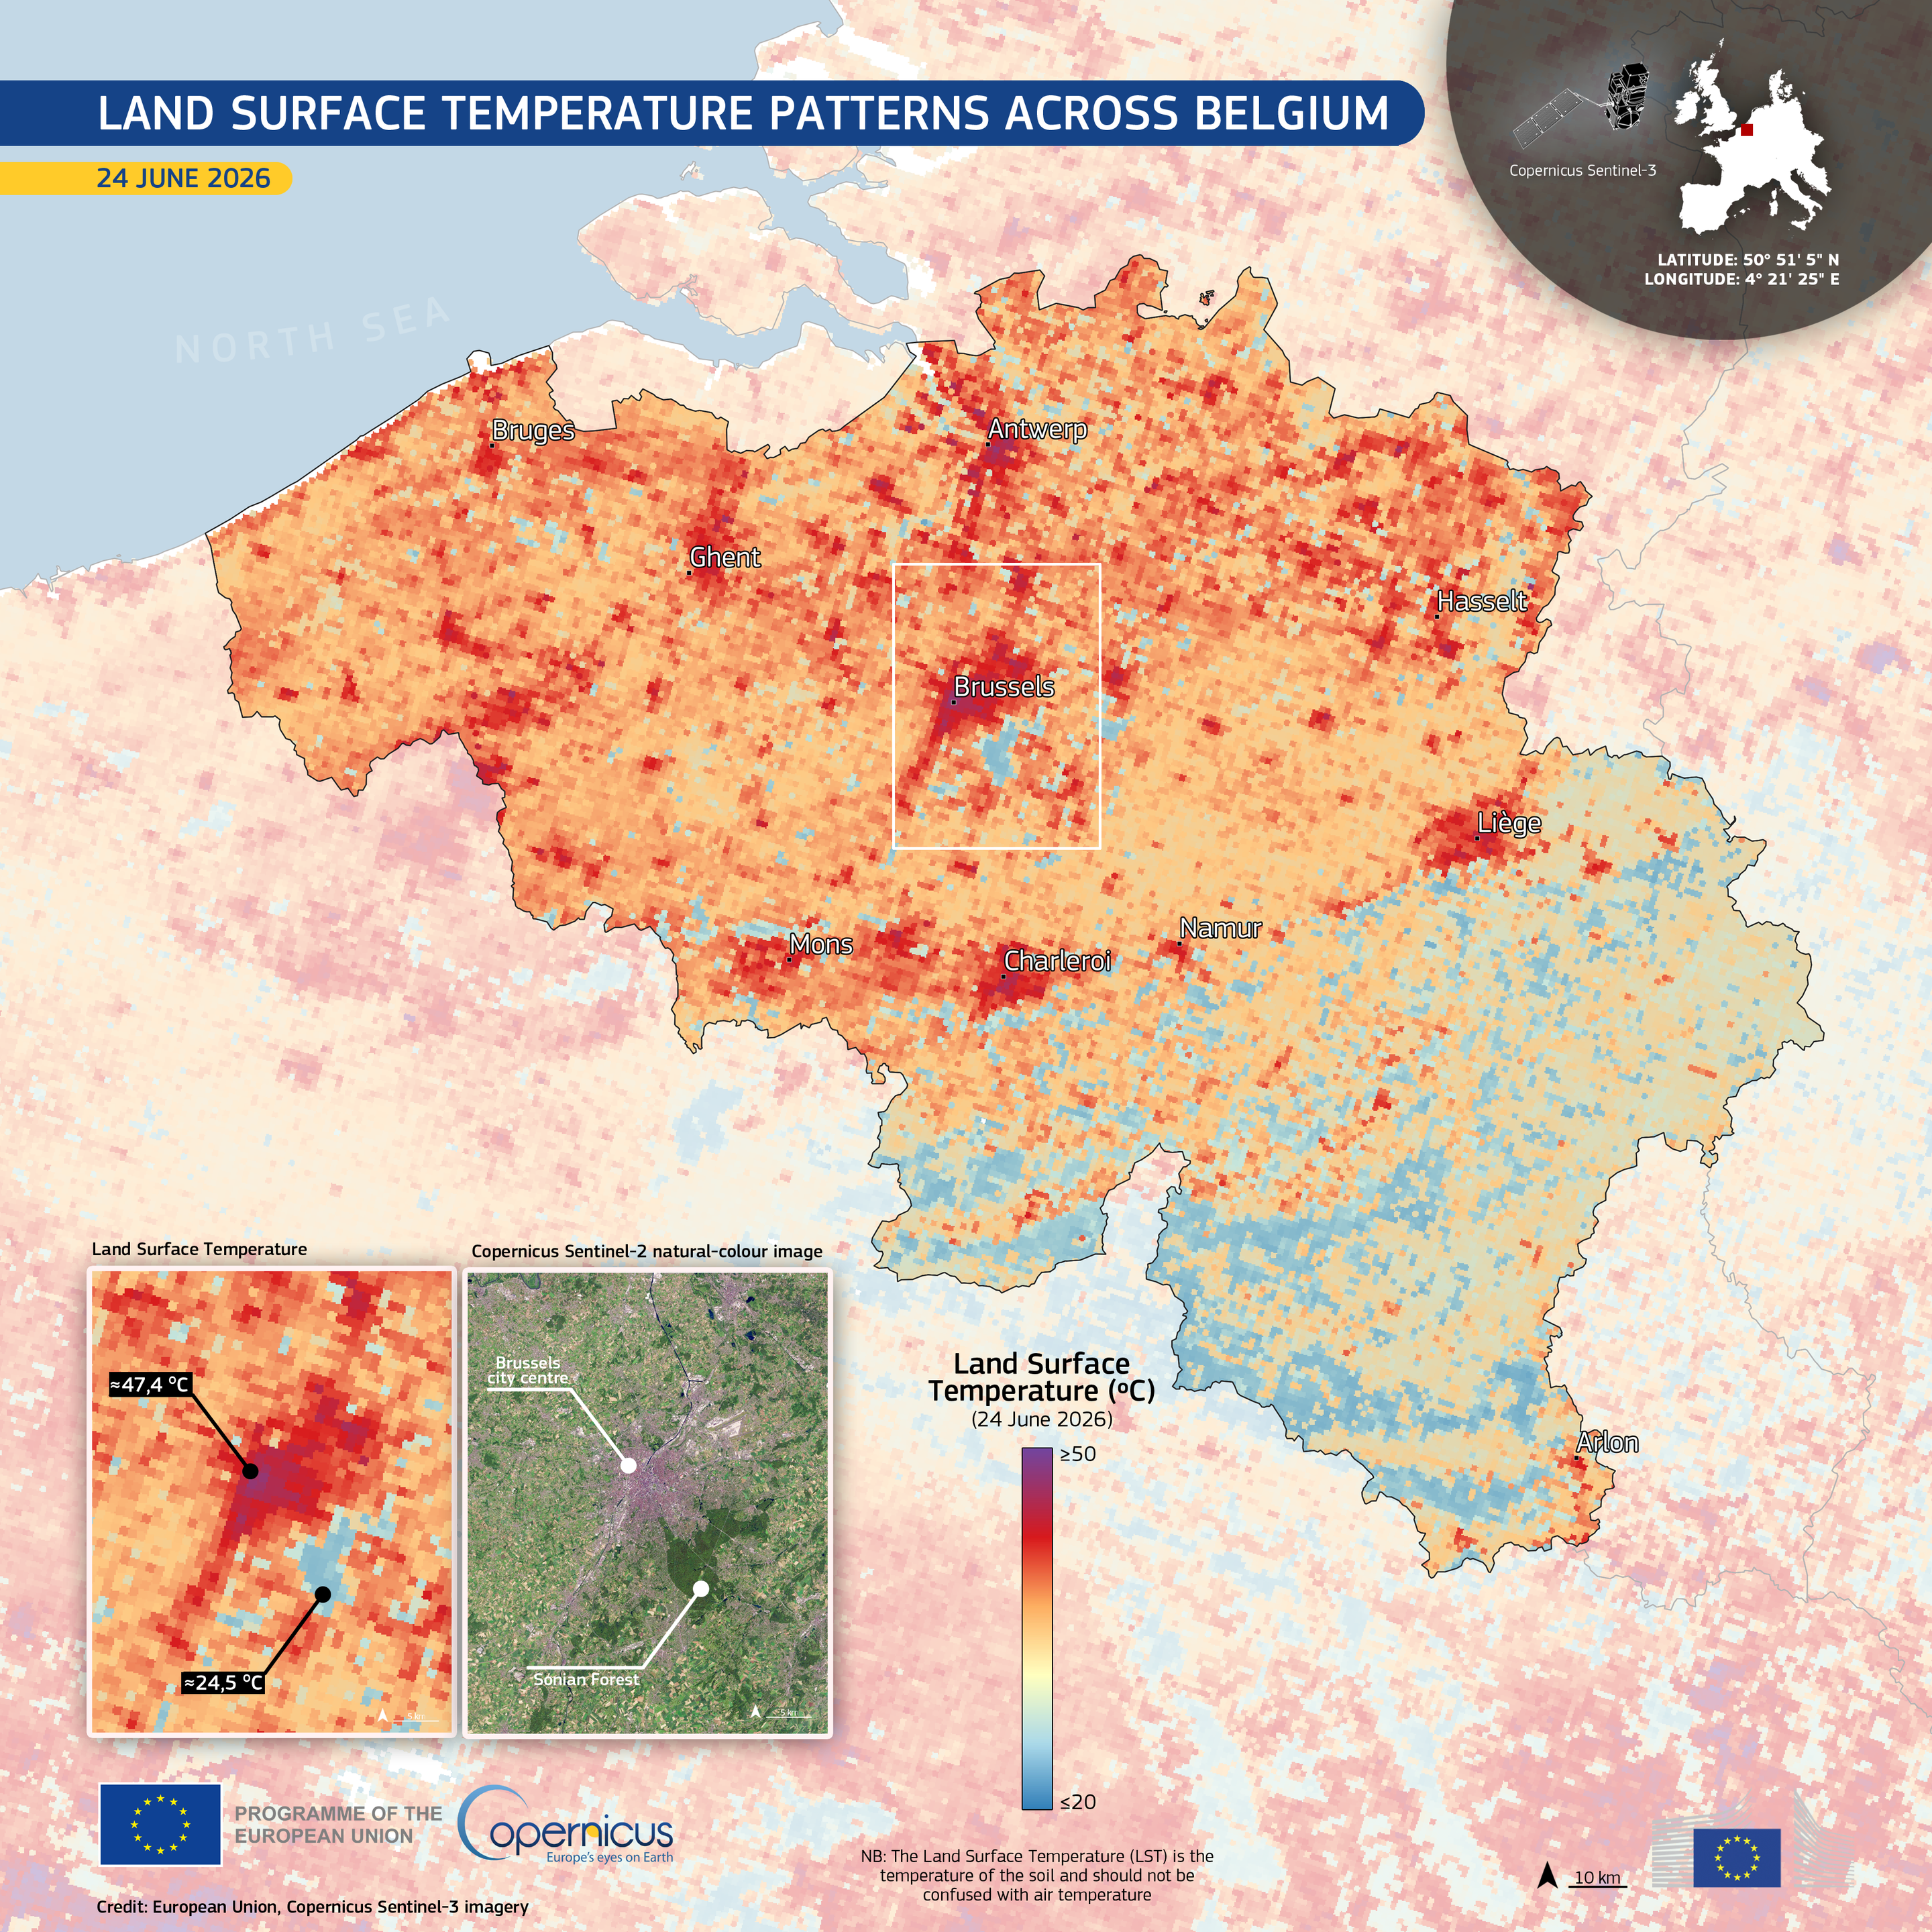
This map displays the land surface temperature patterns across Belgium on June 24, 2026. The temperature data is represented using a colour gradient, with red indicating higher temperatures (above 50°C) and blue indicating lower temperatures (around 20°C). A note explains that the Land Surface Temperature (LST) is the temperature of the soil and should not be confused with air temperature. The enlarged location at the bottom left corner marks two specific points: one with a temperature of approximately 47.4°C pointing to Brussels city and another with around 24.5°C pointing to Sonian Forest right next to it. The map is produced by the Copernicus Sentinel-3 satellite, funded by the European Union.
https://ec.social-network.europa.eu/system/media_attachments/files/116/850/581/857/195/705/original/51bbd34fdaf143d7.png