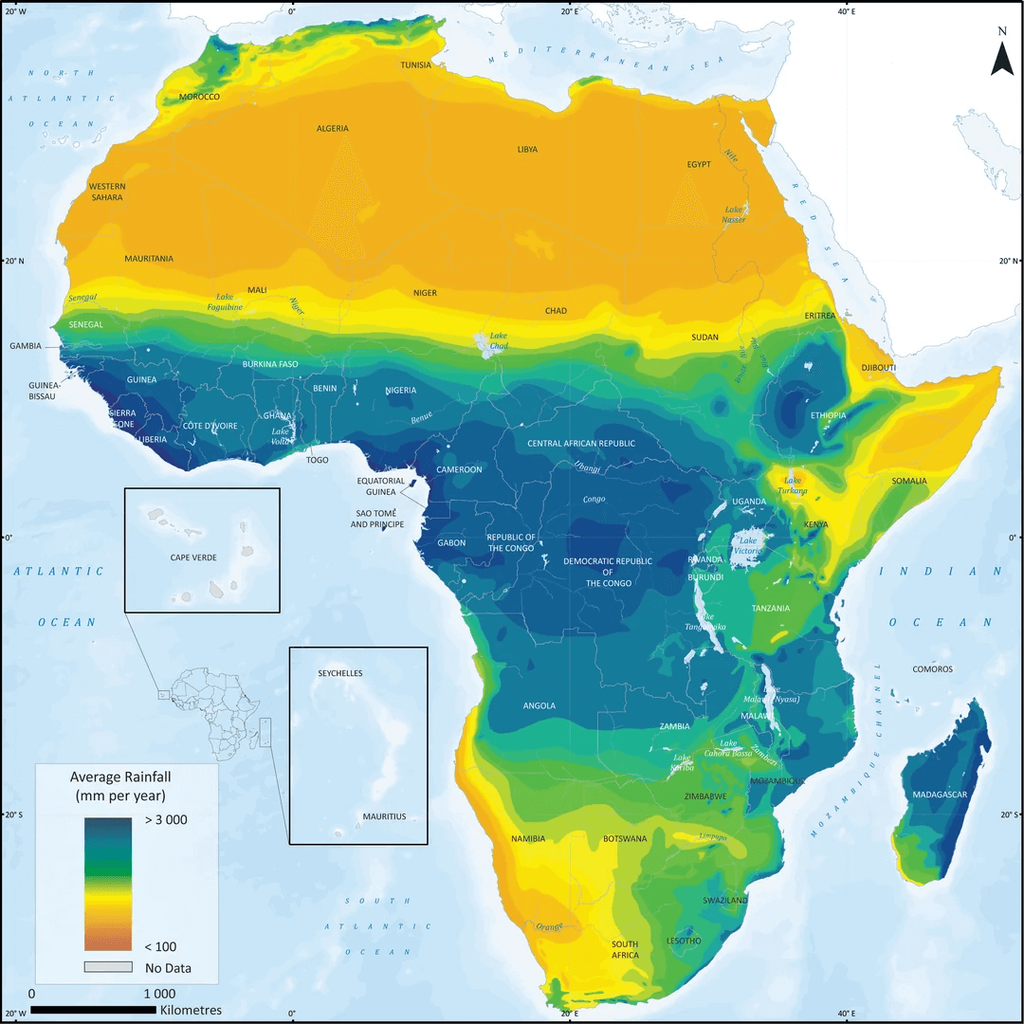
Map of Africa illustrating average rainfall in millimeters per year. A color gradient legend shows that dark blue areas receive over 3000 mm of rainfall annually, transitioning through greens, yellows, oranges, and reds to indicate progressively lower rainfall, with red areas receiving less than 100 mm per year. The map shows high rainfall concentrated in the central and western equatorial regions, decreasing significantly towards the north (Sahara Desert) and the southwest (Namib Desert). Eastern Africa also shows significant rainfall variations. Insets show rainfall data for Cape Verde and Seychelles.
https://cdn.masto.host/vissocial/media_attachments/files/116/743/372/926/038/624/original/121d0f8ab94a48c8.png
 Information Is Beautiful
 All GNU social JP content and data are available under the