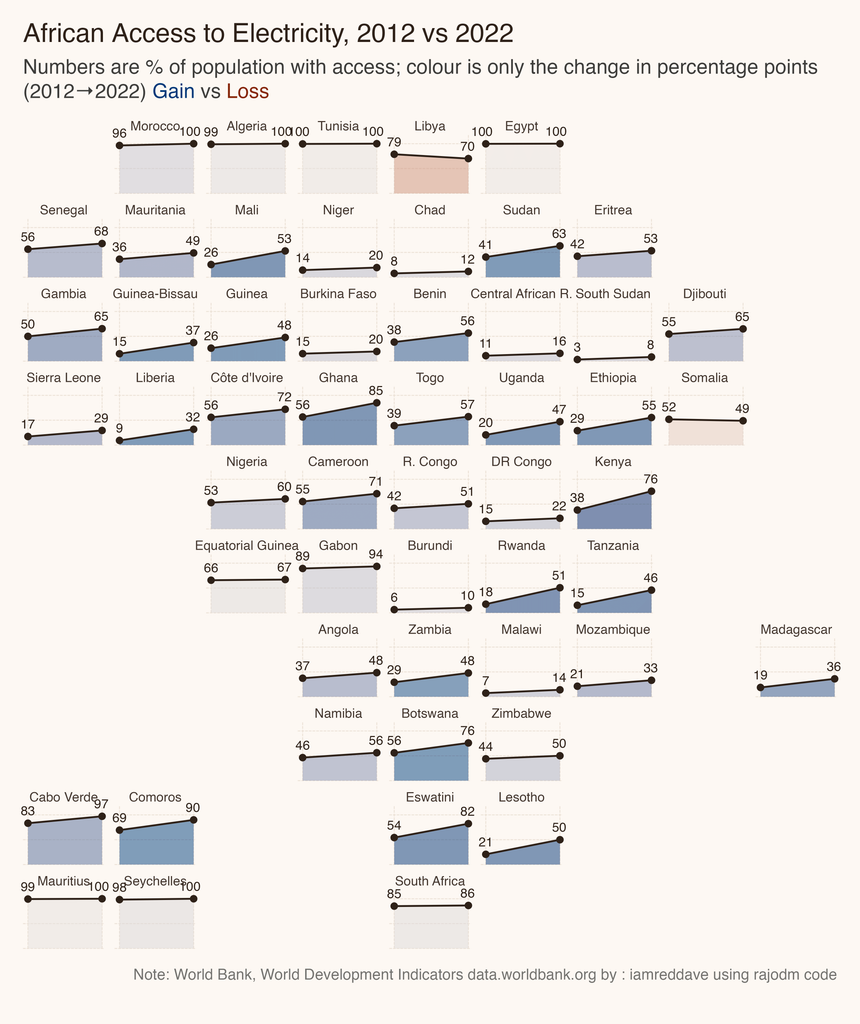
Small multiples boxed cartogram titled 'African Access to Electricity, 2012 vs 2022' showing slope charts for each African country. Each chart displays the percentage of population with electricity access in 2012 and 2022, with blue shading for gains and red for losses. North African countries lead with near-universal access (Morocco 96→100, Algeria 100→100, Tunisia 100→100, Egypt 100→100). Notable gains include Kenya (38→76), Ethiopia (55→8→55→65 area), and Rwanda (15→51). Libya is a rare loss, dropping from 100 to 79. Many sub-Saharan countries remain low but improving, such as Chad (8→12), South Sudan (3→8), and DR Congo (29→47). Mauritius (99→100) and Seychelles (100→100) have full or near-full access. Source: World Bank, World Development Indicators.
https://cdn.masto.host/vissocial/media_attachments/files/116/601/107/390/754/728/original/9386755f7b43dab0.png
 Information Is Beautiful
 All GNU social JP content and data are available under the