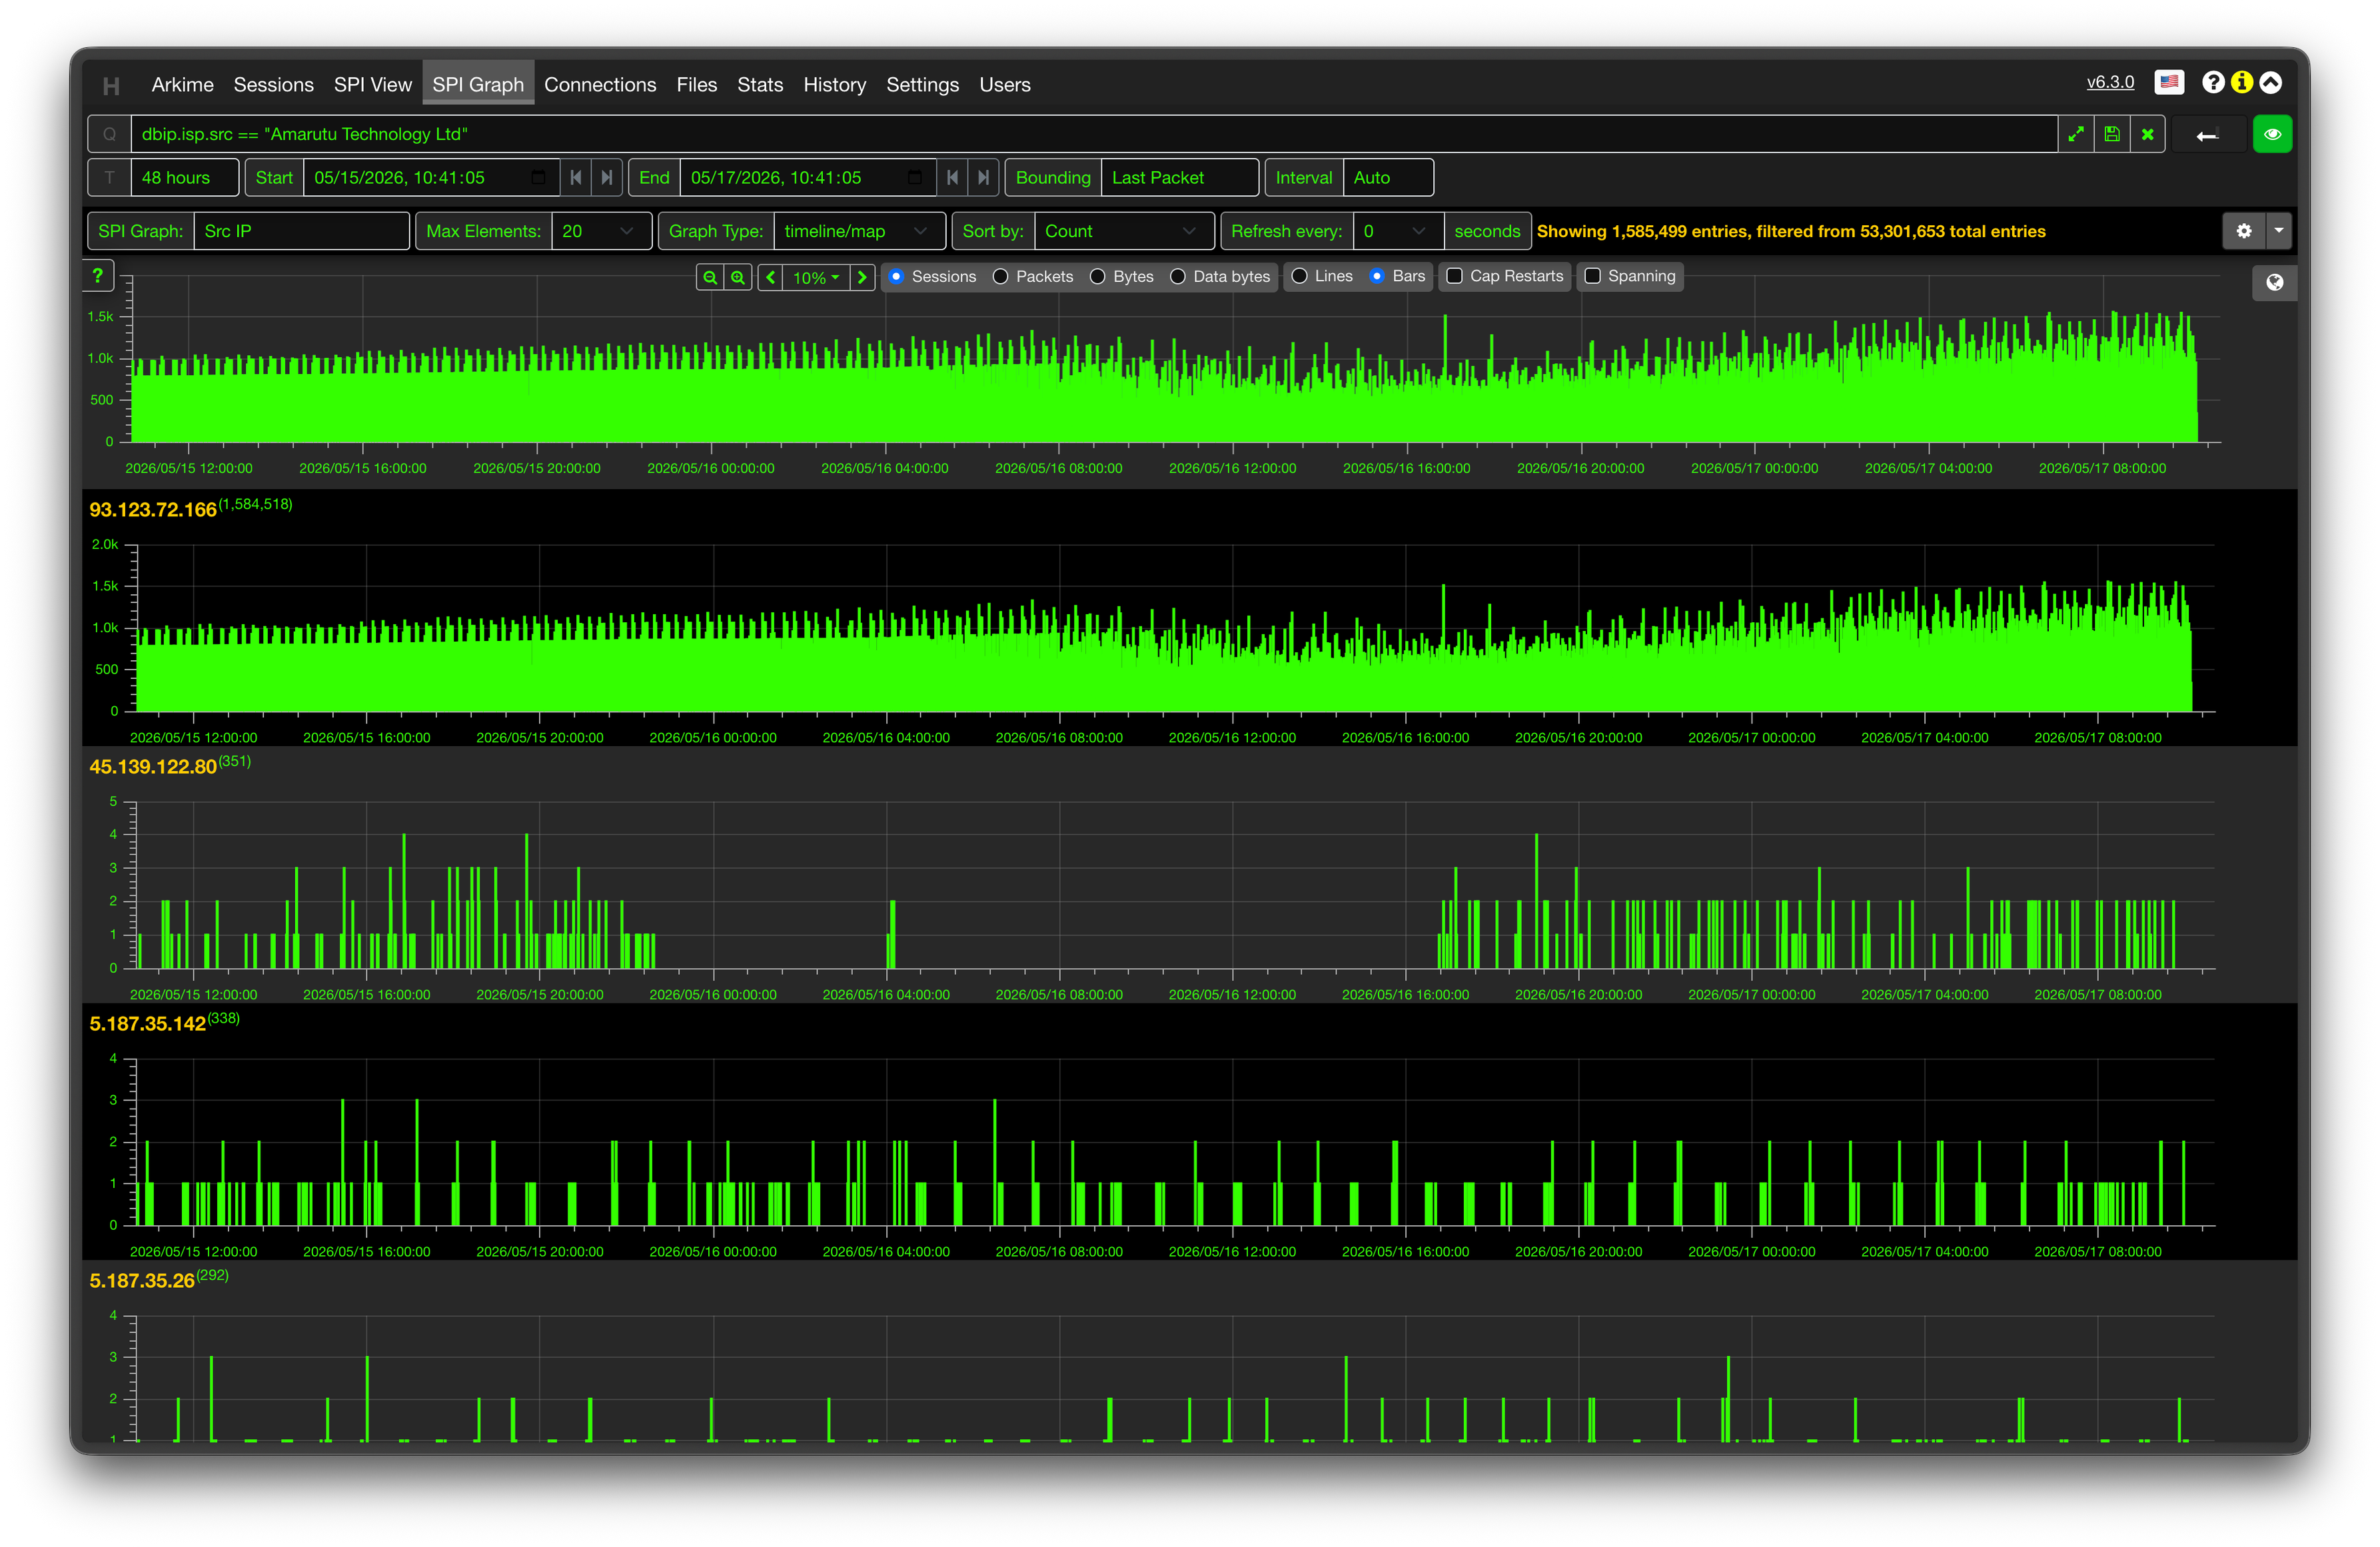
A screenshot of the Arkime network analysis interface, featuring several stacked, horizontal graphs. These graphs display fluctuating data metrics (such as packets, sessions, and bytes) over a timeline spanning from May 15 to May 17, 2020.
https://files.mastodon.social/media_attachments/files/116/590/441/127/694/837/original/a1d6328ab6327efa.png
 hrbrmstr 🇺🇦 🇬🇱 🇨🇦
 All GNU social JP content and data are available under the