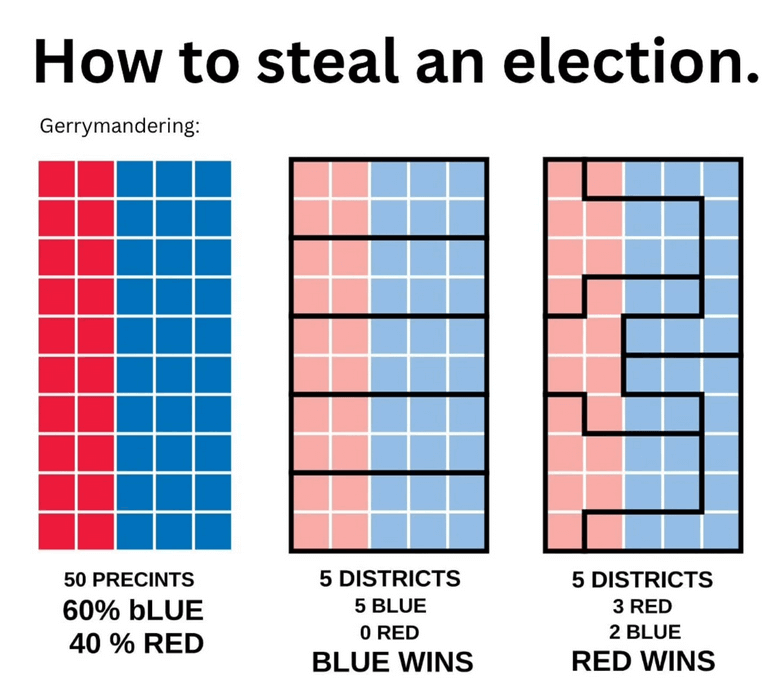
This infographic titled "How to steal an election" shows three visual representations of gerrymandering using a grid-based example, with the first panel displaying 50 precincts arranged in a 10x5 grid where 30 squares are colored blue and 20 squares are colored red, representing a population that is 60% blue and 40% red, followed by a middle panel showing the same colored grid divided into 5 horizontal districts with thick black lines where each district contains a blue majority resulting in 5 blue wins and 0 red wins, and a final panel showing the identical colored grid but with districts drawn using irregular thick black boundary lines that create oddly shaped districts, resulting in 3 red district wins and 2 blue district wins despite the blue majority population, demonstrating how the manipulation of district boundaries can completely reverse electoral outcomes even when the underlying voter preferences remain constant across all three scenarios.
https://cdn.masto.host/vissocial/media_attachments/files/116/517/824/214/838/203/original/5529f03437b5e29b.png
 Information Is Beautiful
 All GNU social JP content and data are available under the