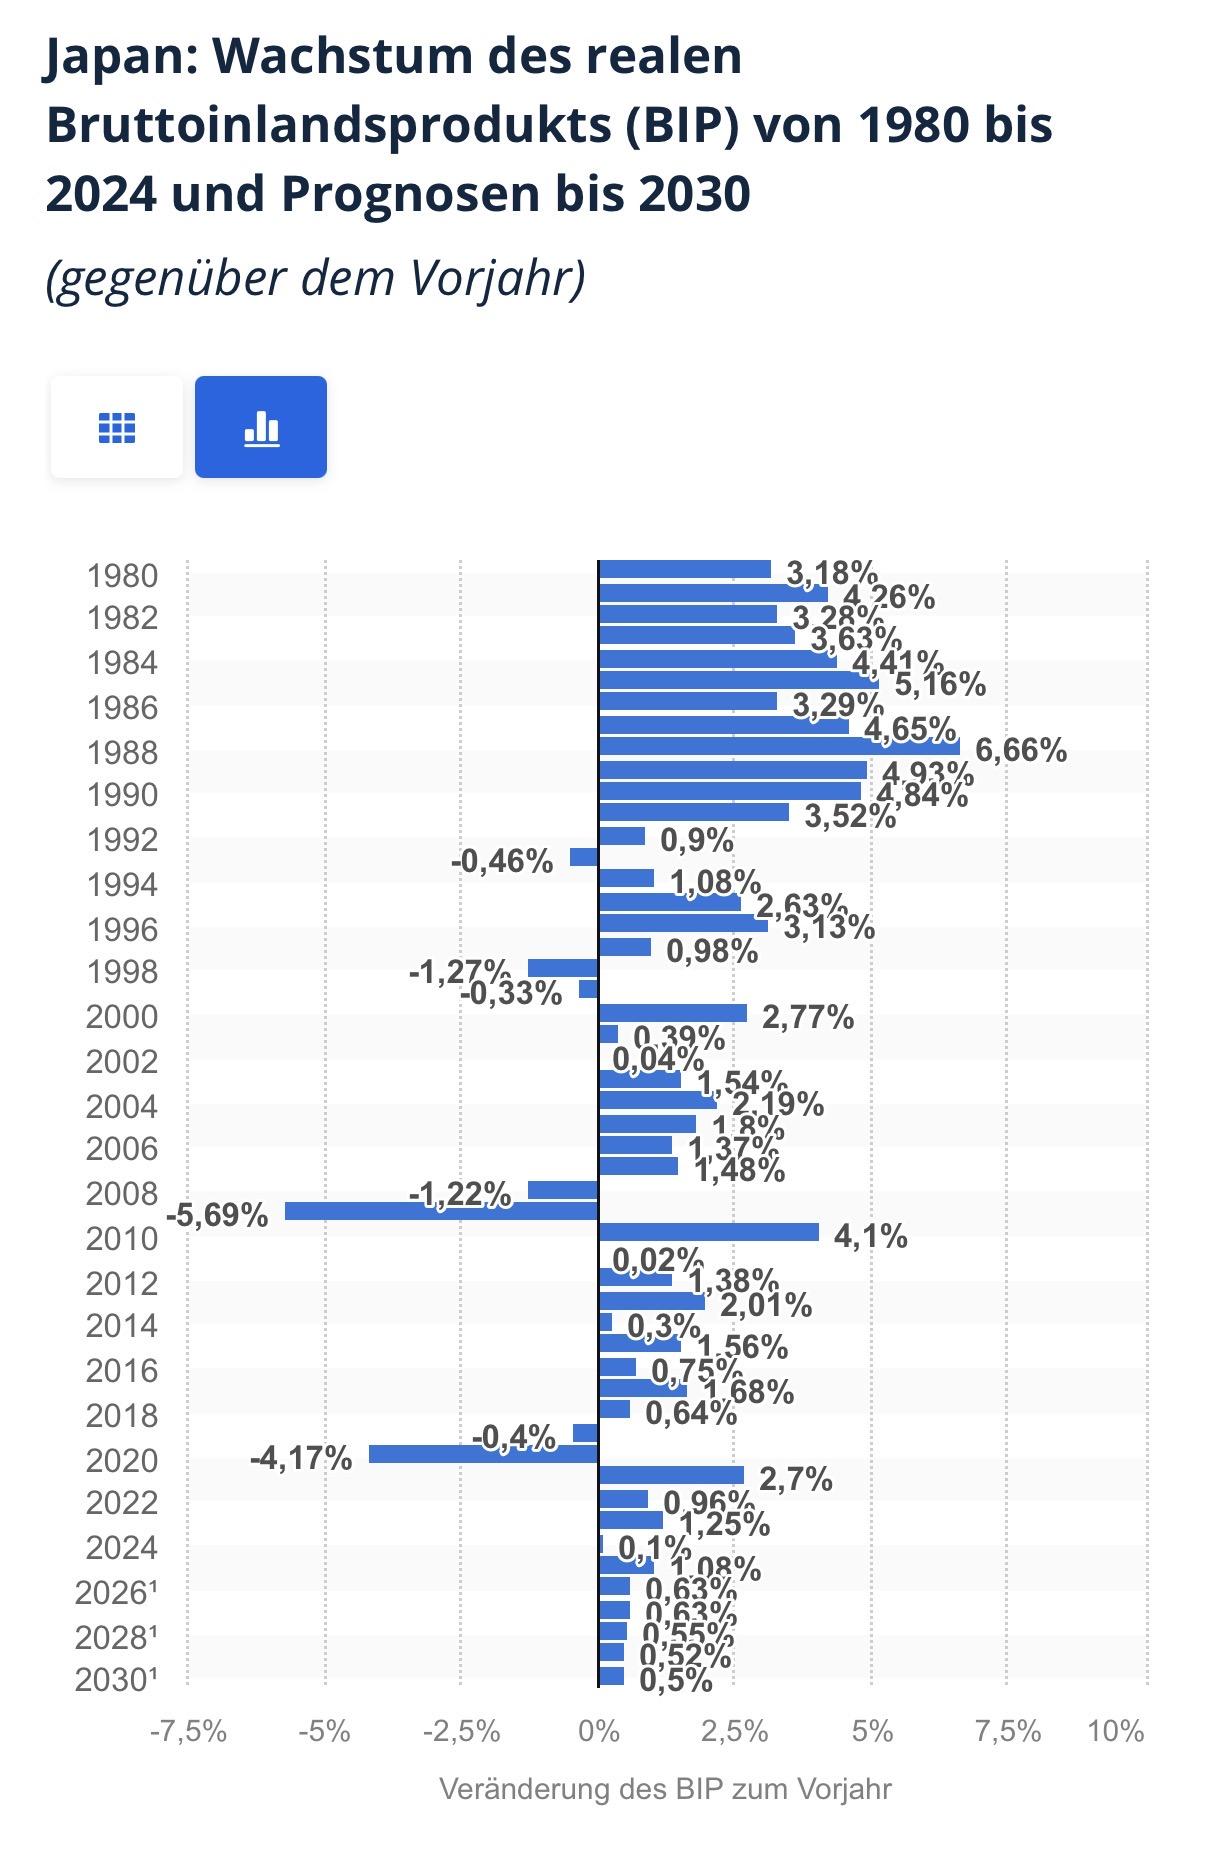
The chart shows a bar graph depicting the trend in Japan’s real gross domestic product (GDP) from 1980 to 2024, along with projections through 2030. It illustrates the year-over-year percentage change for each year. The chart is laid out horizontally: the years are listed on the left, while the bars extend to the right (positive growth) or to the left (negative growth). The scale ranges approximately from -7.5% to +10%. It is striking that Japan recorded predominantly strong growth rates in the 1980s, sometimes exceeding 4% and even 6%. In the 1990s and 2000s, growth slowed significantly, with some years showing negative growth. Particularly sharp declines occurred around 2009 (strongly negative, presumably linked to the global financial crisis) and 2020 (significant decline, likely due to the COVID-19 pandemic). Each was followed by a recovery with positive growth rates. For the future (through 2030), forecasts indicate relatively moderate growth, mostly around 0.5% to 1% per year. Overall, the chart conveys the impression of long-term slowing economic growth in Japan, with occasional crisis-induced slumps followed by recovery phases.
https://files.mastodon.social/media_attachments/files/116/359/712/890/323/117/original/0a4037e2157b969a.jpeg