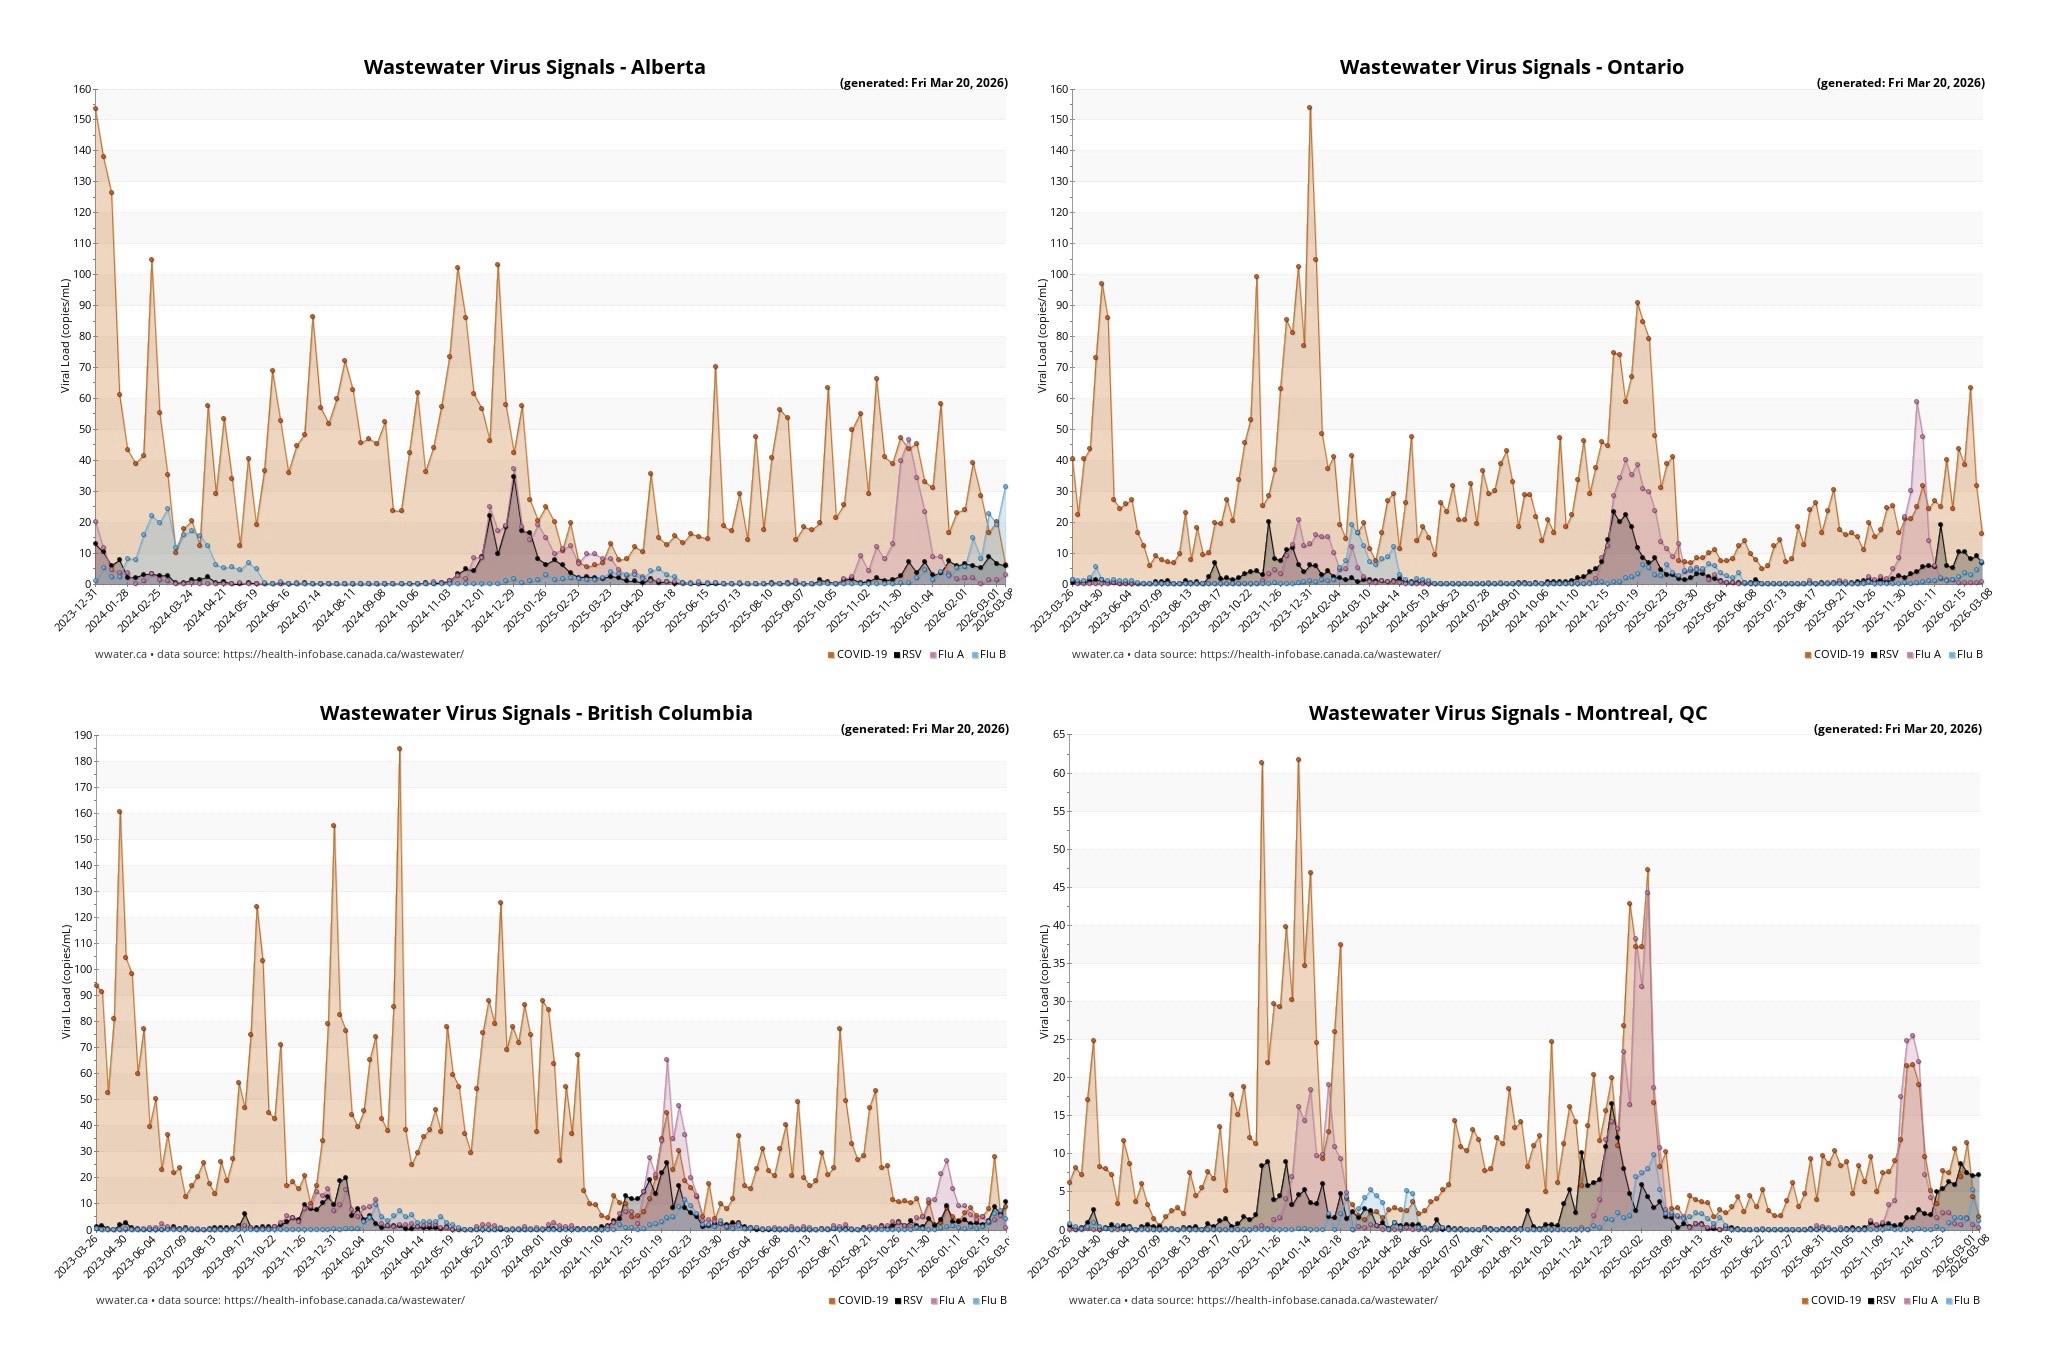
snapshots of four wastewater graphs in Canada top row: Alberta and Ontario bottom row: British Columbia and Montreal, Quebec graphs span approximately three years (2023–2026) of wastewater tracking Covid as well as Flu A and B and RSV. the Covid waves are getting progressively smaller over time but still mostly tower over Flu and RSV.
https://files.ohai.social/media_attachments/files/116/281/260/859/614/530/original/1d97a4152d010eac.jpeg