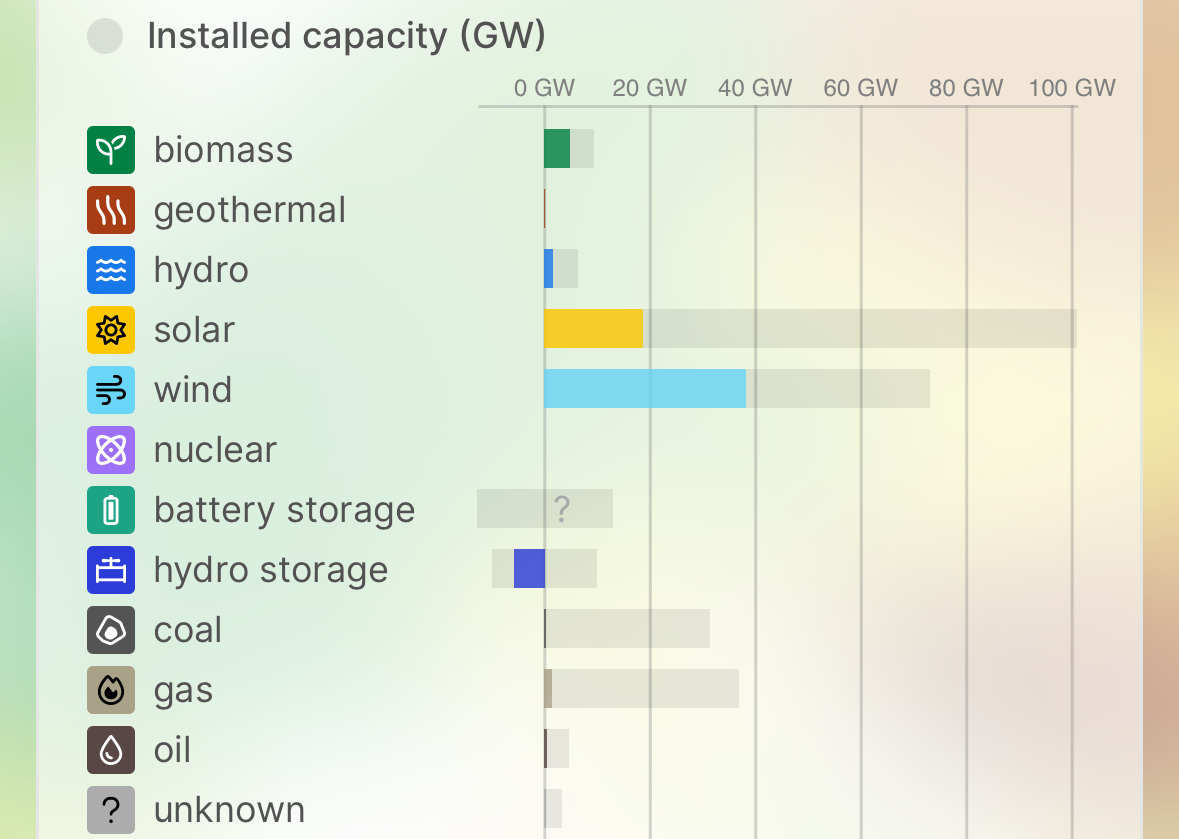
Bar chart showing the installed capacity and current usage of renewable energy. Values as described in the post.
https://narrativ.es/system/media_attachments/files/115/321/060/264/966/381/original/fda7968ee8092472.png
Neat, Germany is currently producing 97% of its ~50GW energy from renewables.
Roughly 2/3 wind and 1/3 solar.
Yes it’s Sunday of a long weekend, but weekday loads are 60–65GW tops, so this ain’t half bad, as we’re using a little more than 1/2 of the installed wind capacity and less than 1/5th installed solar capacity (modulo time of year).
Oh and we are exporting 5–10GW on top and prices are low to zero.
Love everything* about this.
(*still lots to be done)
GNU social JP is a social network, courtesy of GNU social JP管理人. It runs on GNU social, version 2.0.2-dev, available under the GNU Affero General Public License.
![]() All GNU social JP content and data are available under the Creative Commons Attribution 3.0 license.
All GNU social JP content and data are available under the Creative Commons Attribution 3.0 license.