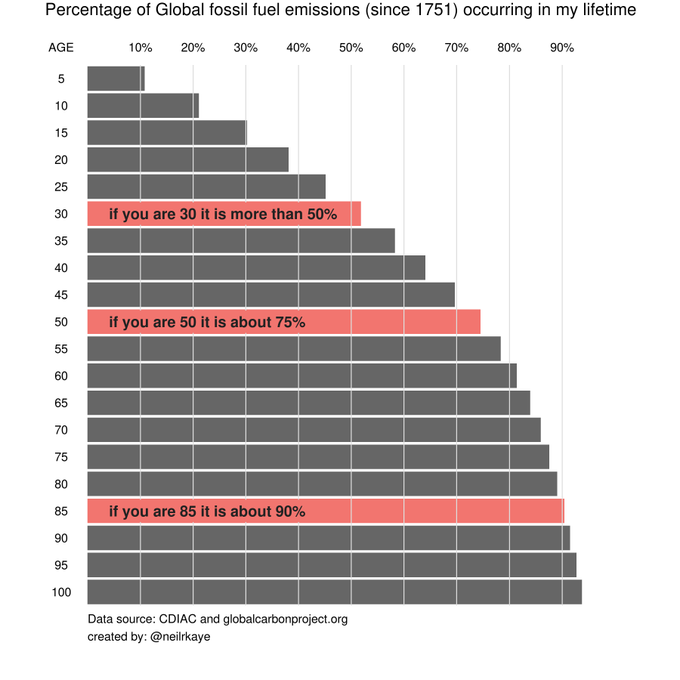
Bar chart shows the % of global fossil fuel emissions occurring in a lifetime with bars of different length for ages from 5 to 100 years. More emissions happen over a longer lifetime. During the life of an 85 year old, 90% of all emissions happened. For someone age of 30 the rate is already 50%
https://cdn.masto.host/vissocial/media_attachments/files/114/614/345/153/905/963/original/0e2256a63d892c98.png