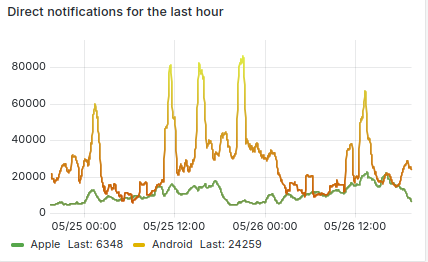
a graph showing "Direct push notifications for the last hour" On the X axis it starts around May 24th 7:30pm and goes until May 26th 7:30pm. On the X axis it goes from 0 to 80K notifications for the last hour. There are two plot lines: - Apple push notifications which are in the range of 7K and 15K notifications in every hour. - Google Play notifications which is between 10k and 80k notifications per hour. There are around 5 spikes that go up to 70k or above 80k notifications in every hour.
https://assets.chaos.social/media_attachments/files/114/575/309/610/124/810/original/84c7fb769e6f1fe6.png