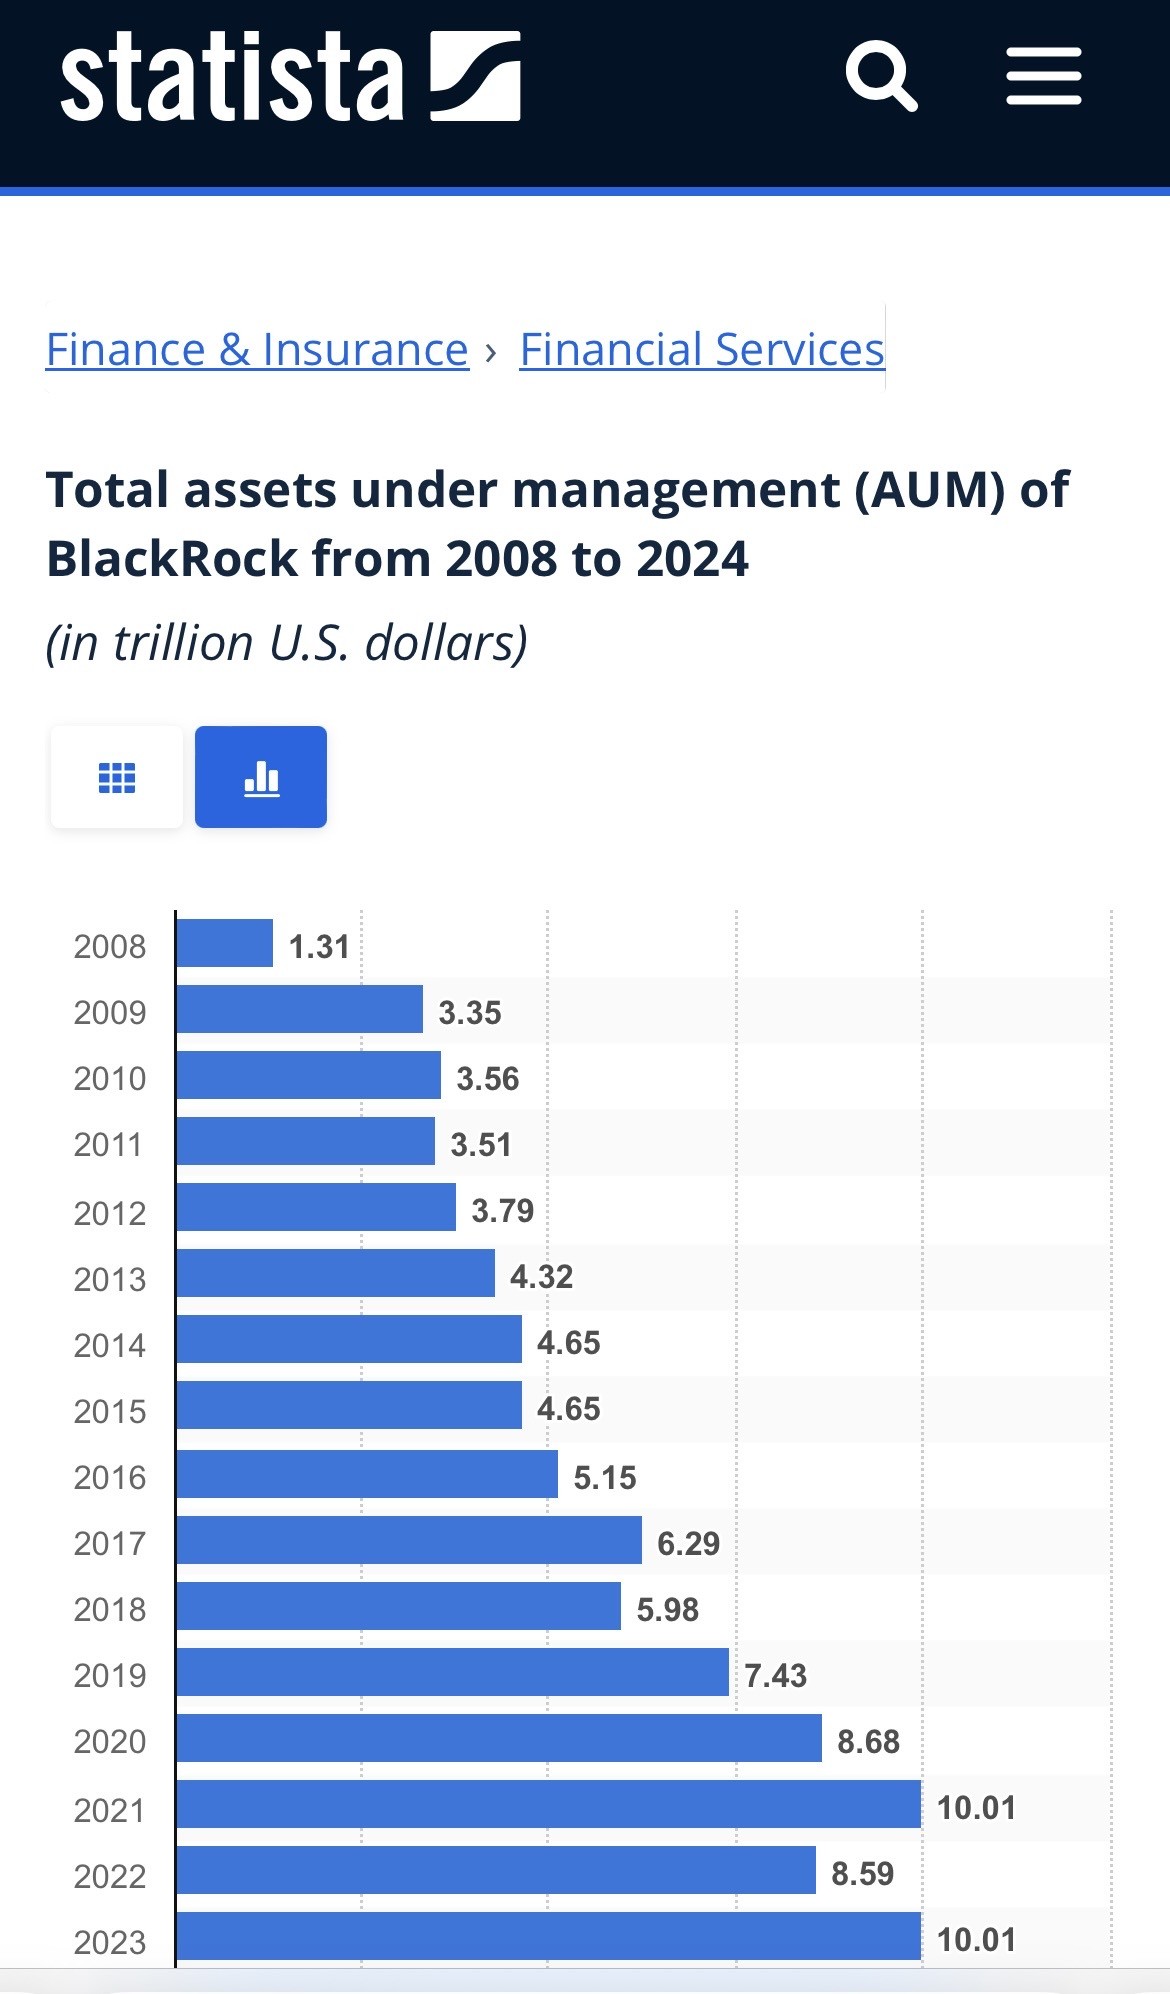
A bar chart with blue horizontal bars, showing increase in assets held by black Rock btw 2008 and 2024. I don’t have time to put in all the numbers now but you csn check the website, link in post
https://files.mastodon.green/media_attachments/files/113/571/189/664/366/676/original/2e10e5e064c50ab6.jpeg