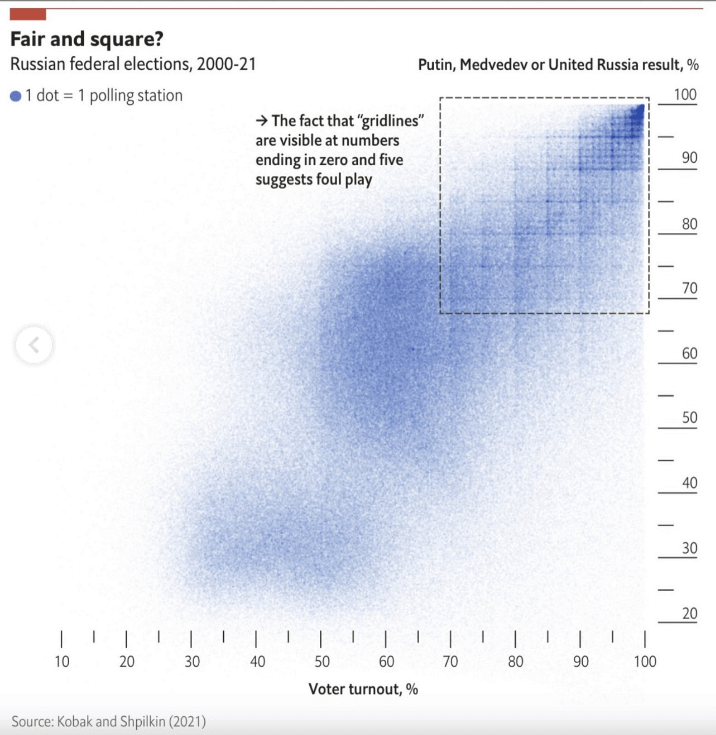
A scatter plot titled "Fair and square? Russian federal elections, 2000-21" which visualizes the results of Russian federal elections. The x-axis represents voter turnout in percentage, ranging from 0 to 100%. The y-axis represents the percentage of votes for Putin, Medvedev, or the United Russia party, also ranging from 0 to 100%. Each dot on the plot represents a polling station. A cluster of dots appears in the upper right corner, indicating high voter turnout and a high percentage of votes for the specified candidates. A dashed rectangle highlights a grid-like pattern of dots at numbers ending in zero and five, with an annotation suggesting this pattern indicates potential foul play. The source is cited as Kobak and Shpilkin (2021).
https://cdn.masto.host/vissocial/media_attachments/files/114/478/449/794/864/861/original/d5e0c3f7af615166.png