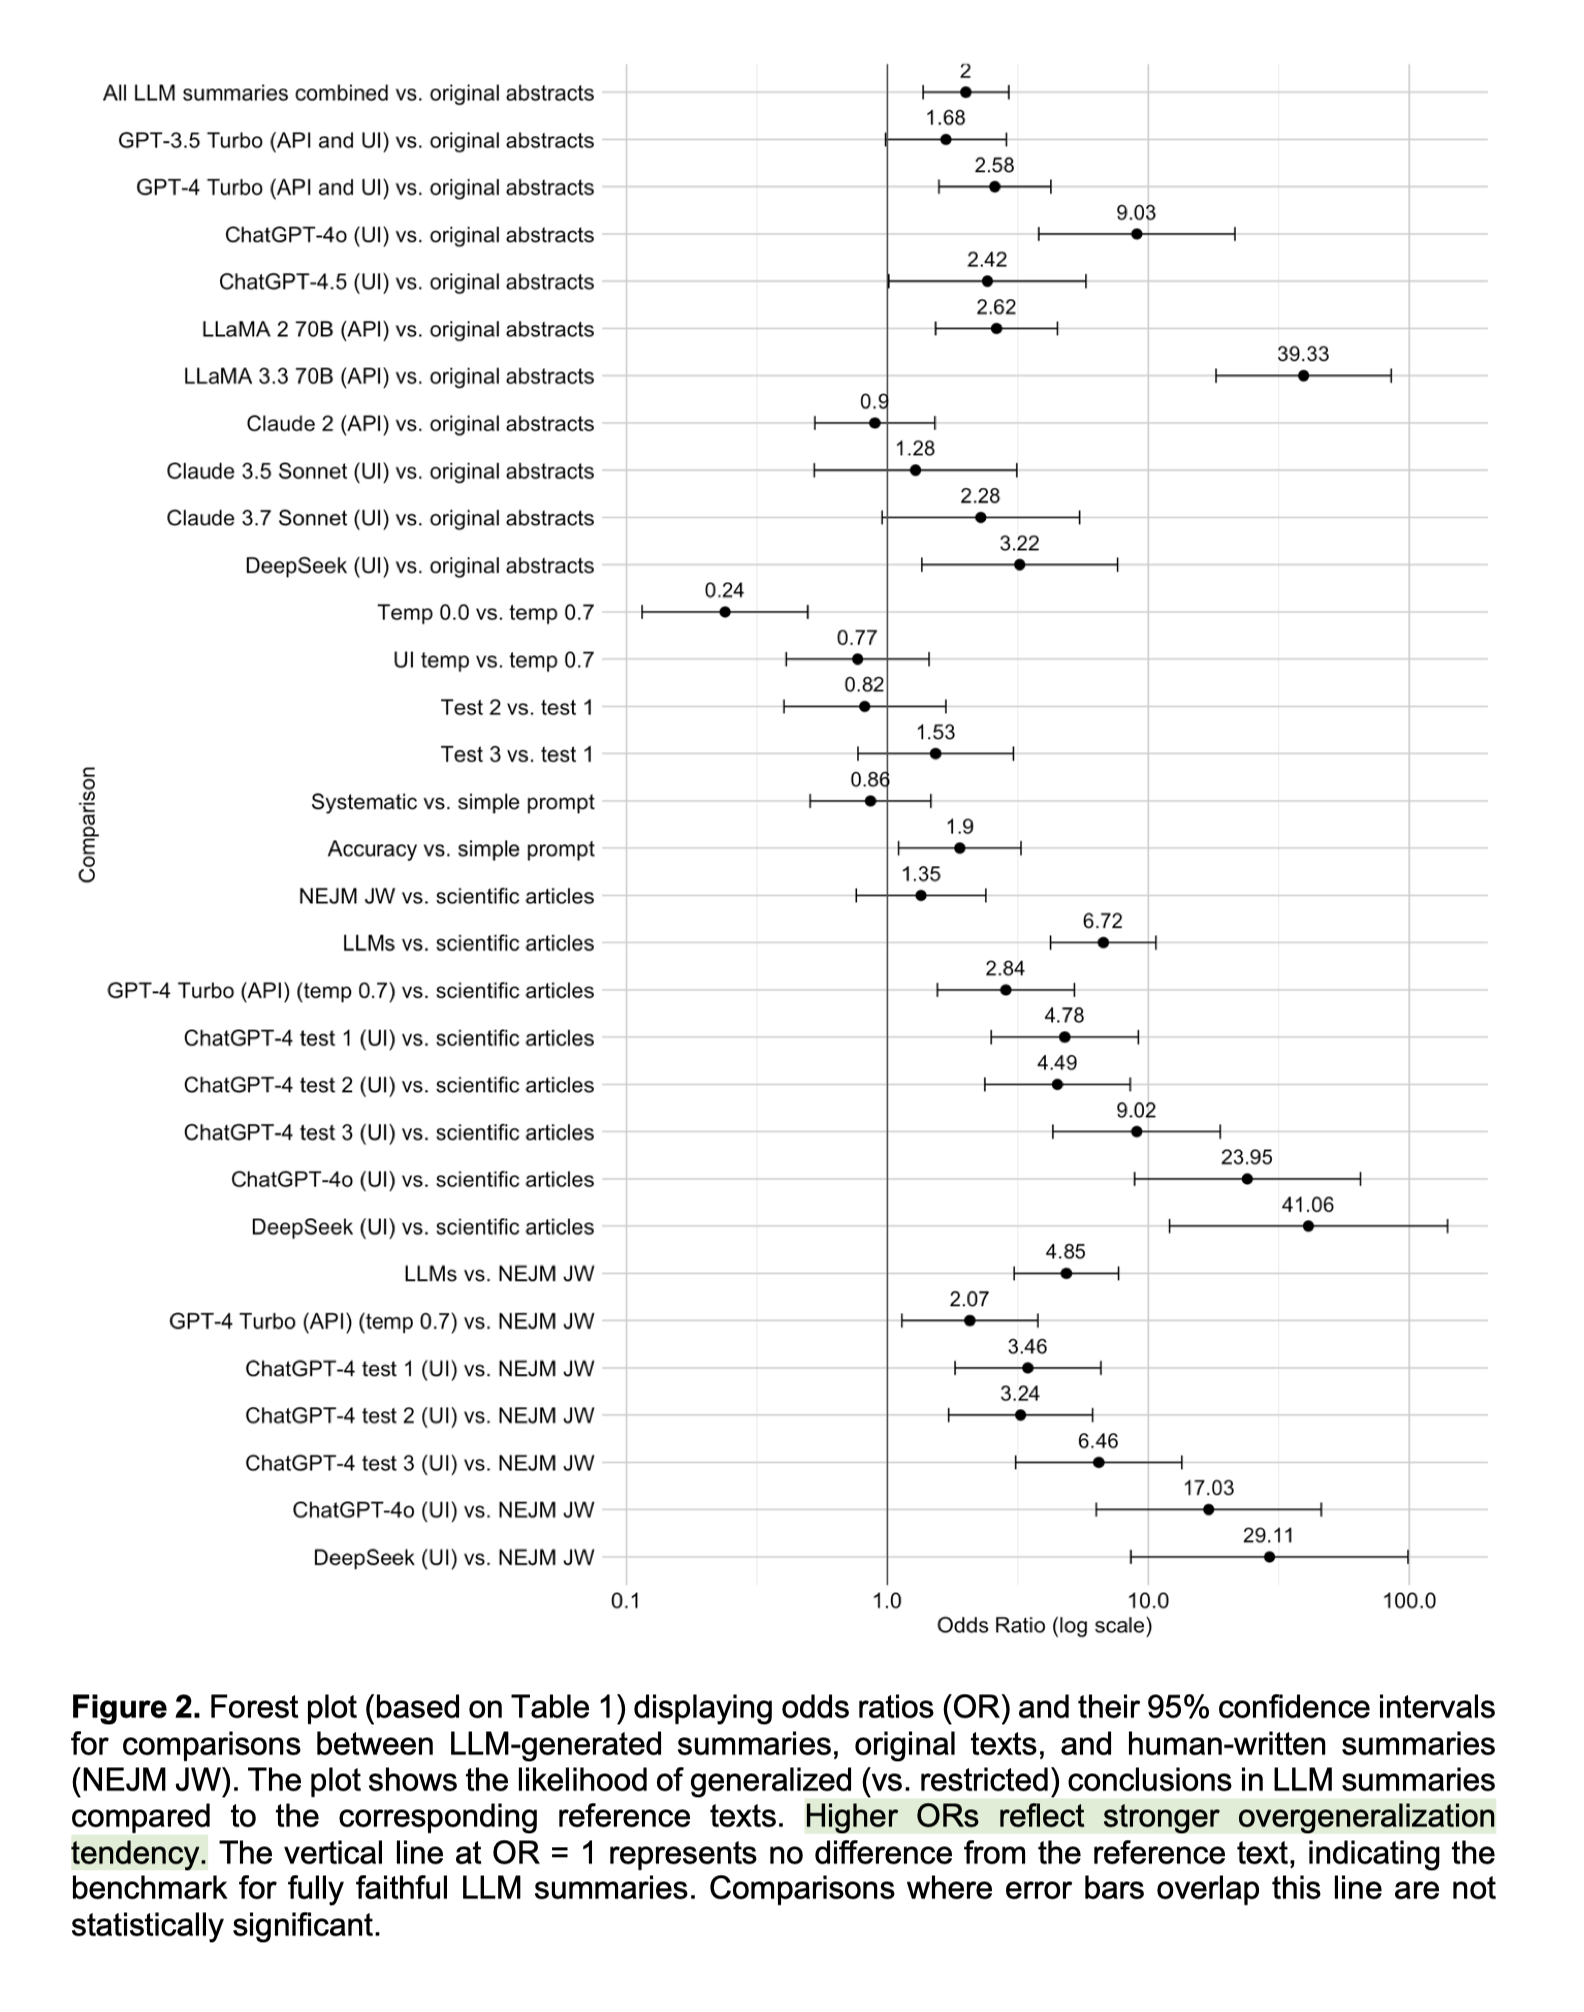
Figure 2. Forest plot (based on Table 1) displaying odds ratios (OR) and their 95% confidence intervals for comparisons between LLM-generated summaries, original texts, and human-written summaries (NEJM JW). The plot shows the likelihood of generalized (vs. restricted) conclusions in LLM summaries compared to the corresponding reference texts. Higher ORs reflect stronger overgeneralization tendency. The vertical line at OR = 1 represents no difference from the reference text, indicating the benchmark for fully faithful LLM summaries. Comparisons where error bars overlap this line are not statistically significant.
https://nerdculture.de/system/media_attachments/files/114/354/538/763/194/441/original/2761776820dc6283.png