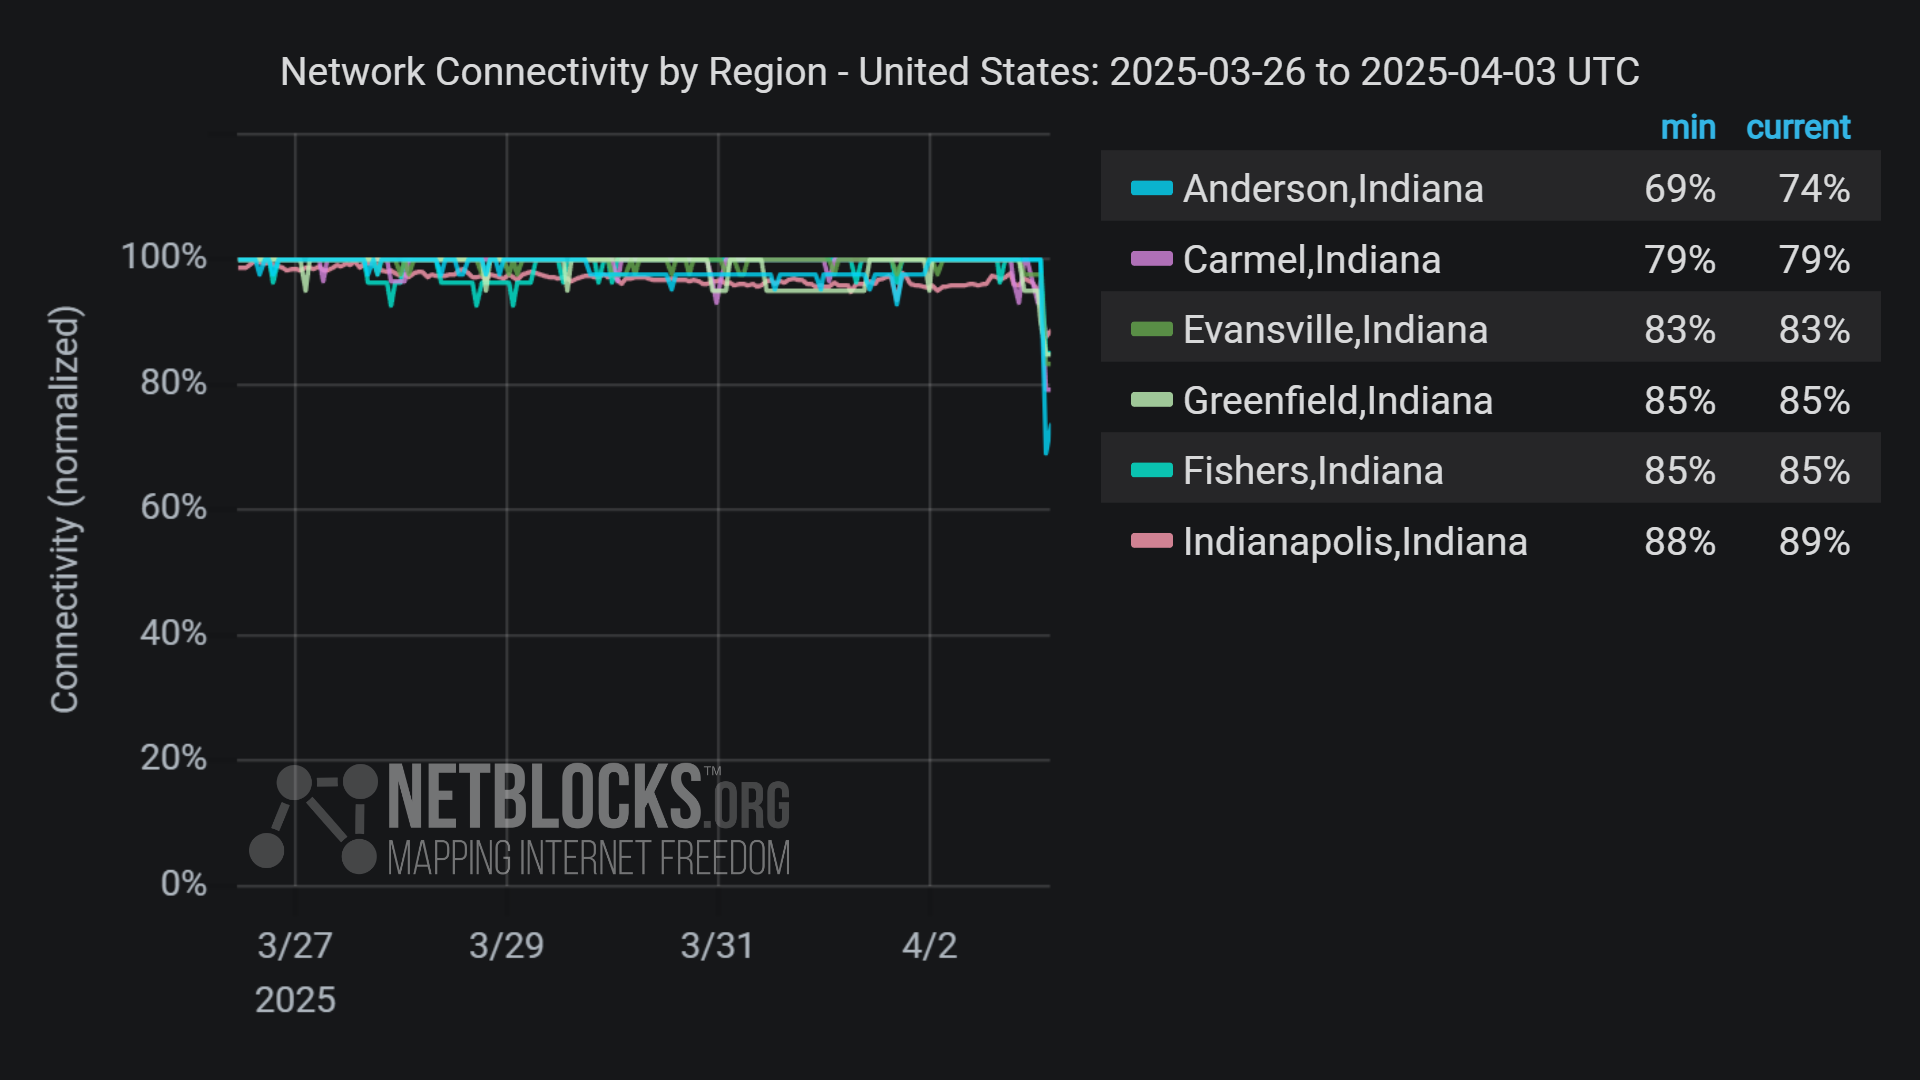
Graph from NetBlocks showing network connectivity by region in United States from March 26, 2025, to April 3, 2025. The y-axis represents normalized connectivity, ranging from 0% to 100%, and the x-axis represents the dates. The graph indicates connectivity disruptions across Indiana on April 3, 2025 due tornadoes. The chart has a dark background, and connectivity lines for each city are color-coded.
https://files.mastodon.social/media_attachments/files/114/271/999/167/743/724/original/b0a30c8f5fc85ac3.png