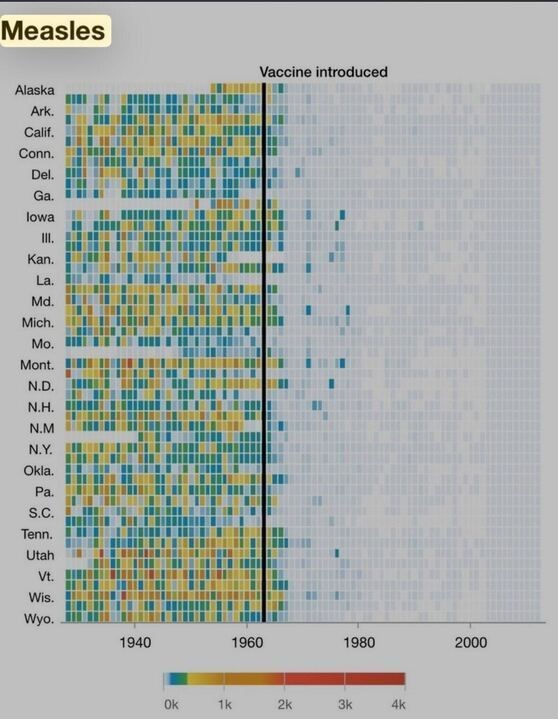
The image is a heatmap titled "Measles," showing measles cases across U.S. states from 1928 to 2003. States listed on the y-axis include Alaska, Arkansas, California, Connecticut, Delaware, Georgia, Iowa, Illinois, Kansas, Louisiana, Maryland, Michigan, Missouri, Montana, North Dakota, New Hampshire, New York, Oklahoma, Pennsylvania, South Carolina, Tennessee, Utah, Vermont, Wisconsin, and Wyoming. The x-axis spans years from 1928 to 2003. A vertical line marks the introduction of the measles vaccine around 1963. The color scale at the bottom ranges from blue (0 cases) to red (4,000+ cases), with shades of green, yellow, and orange indicating intermediate values (1,000, 2,000, 3,000 cases). Before 1963, many states show frequent high case numbers (yellow to red), while after 1963, cases drop significantly, with mostly blue indicating near-zero cases.
https://media.universeodon.com/media_attachments/files/114/252/565/930/572/339/original/9454582e26a9b136.jpeg