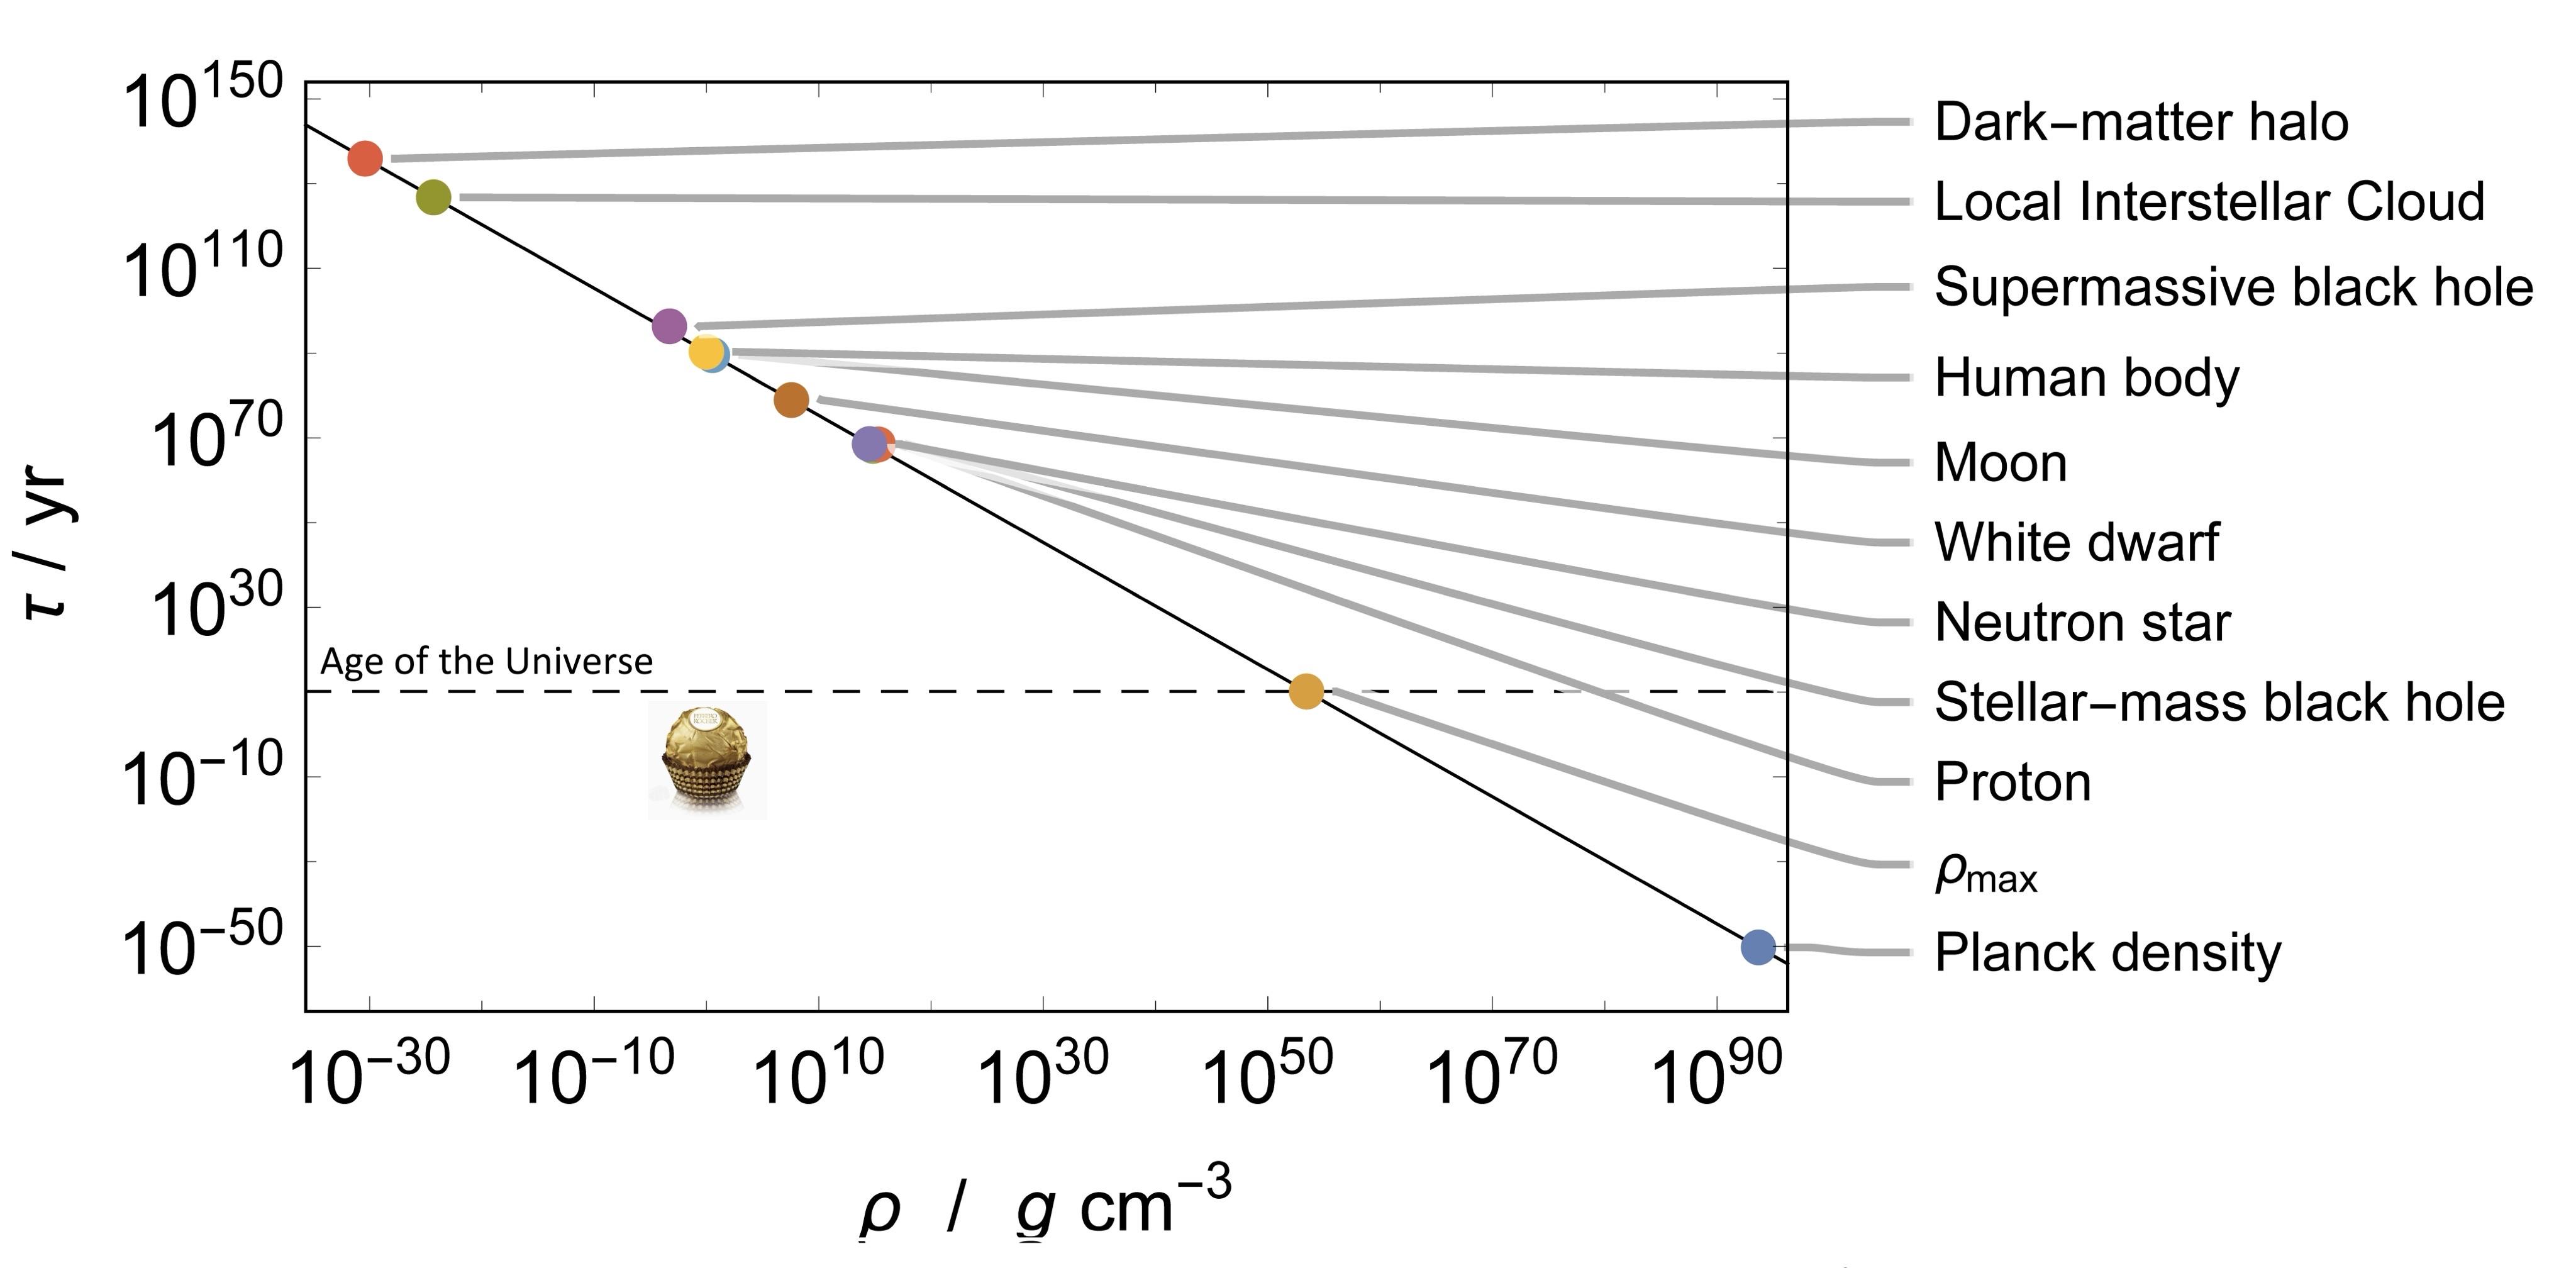
A graph illustrating the relationship between the lifetime (τ) in years and density (ρ) in grams per cubic centimeter. Key points represent various astronomical objects and phenomena, including dark matter, a human body, planets, and different types of stars, and a piece of chocolate.
https://files.mastodon.social/media_attachments/files/114/189/798/036/053/527/original/4a9dfd935cc60b1b.jpeg
 Prof Heino Falcke
 All GNU social JP content and data are available under the