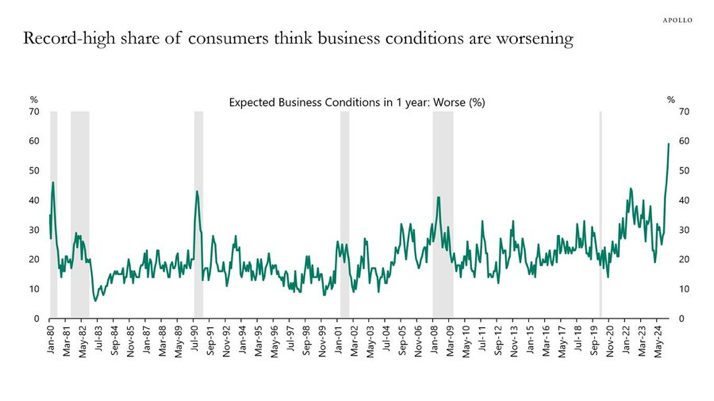
Alt text for screen reader: A line graph titled “Record-high share of consumers think business conditions are worsening.” Subtitle: “Expected Business Conditions in 1 year: Worse (%).” The x-axis shows dates from January 1980 to May 2024, and the y-axis shows percentages from 0% to 70%. The line fluctuates over time, indicating the percentage of consumers who expect worse business conditions in one year. Key points: • The percentage starts high in early 1980, then declines and fluctuates between 10% and 40% over most of the time period. • Notable peaks occur around 1990, 2001, 2008, and 2020, coinciding with shaded grey areas, representing recessions. • The line rises steeply in 2022–2023, peaking at an all-time high of nearly 65% in early 2025, marking a record-high pessimism among consumers. • Source: APOLLO in the top-right corner.
https://files.mastodon.social/media_attachments/files/114/174/042/298/613/570/original/17dc2a82130984c8.png