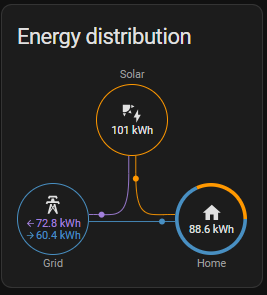
A fancy diagram showing where all the energy went: how much my house used during the day, how much I solar I produced, and how much of that I sold back to the grid.
https://social.dinn.ca/system/media_attachments/files/114/158/872/809/116/209/original/ec84bd4686ee0068.png