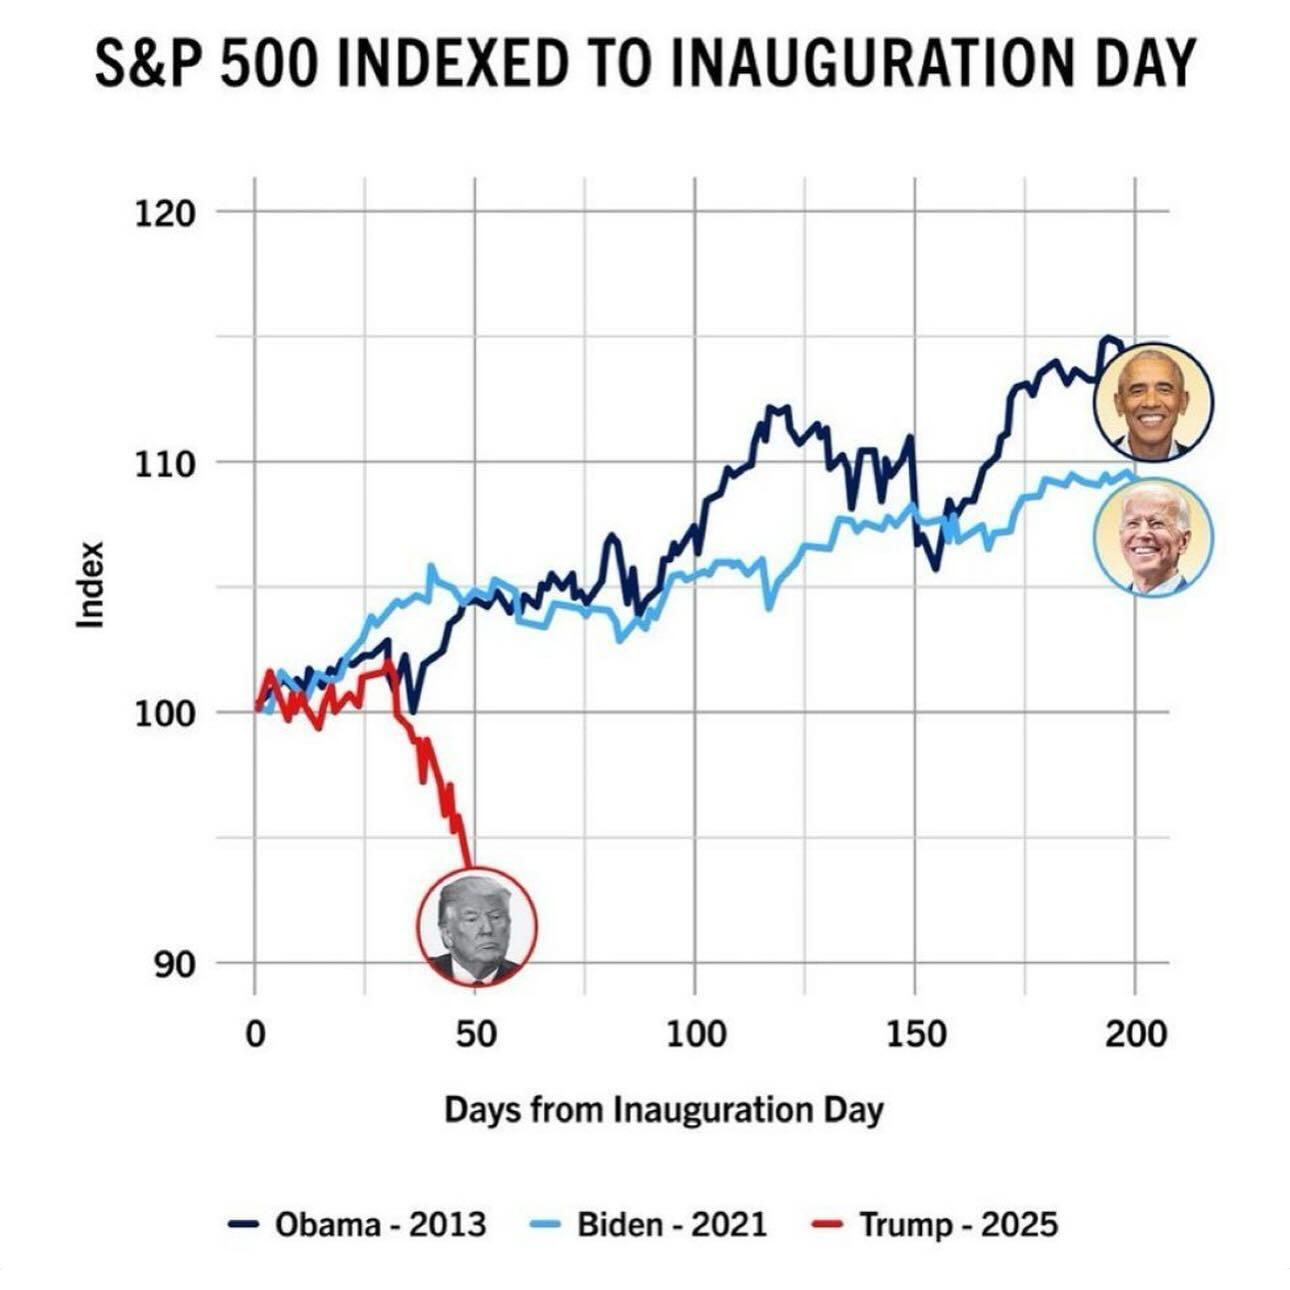
A line chart titled "S&P 500 Indexed to Inauguration Day" with the x-axis labeled "Days from Inauguration Day" and the y-axis labeled "Index." The chart compares the performance of the S&P 500 during the early months of three presidential terms. A dark blue line represents Barack Obama's 2013 term, a light blue line represents Joe Biden's 2021 term, and a red line represents Donald Trump's 2025 term. The dark blue and light blue lines trend upward, while the red line trends downward. Each line ends with a circular image of the respective president. Obama's and Biden's images are placed at higher points on the chart, while Trump's image is placed lower.
https://files.mastodon.online/media_attachments/files/114/157/190/631/141/761/original/f2676a58730df15d.jpeg