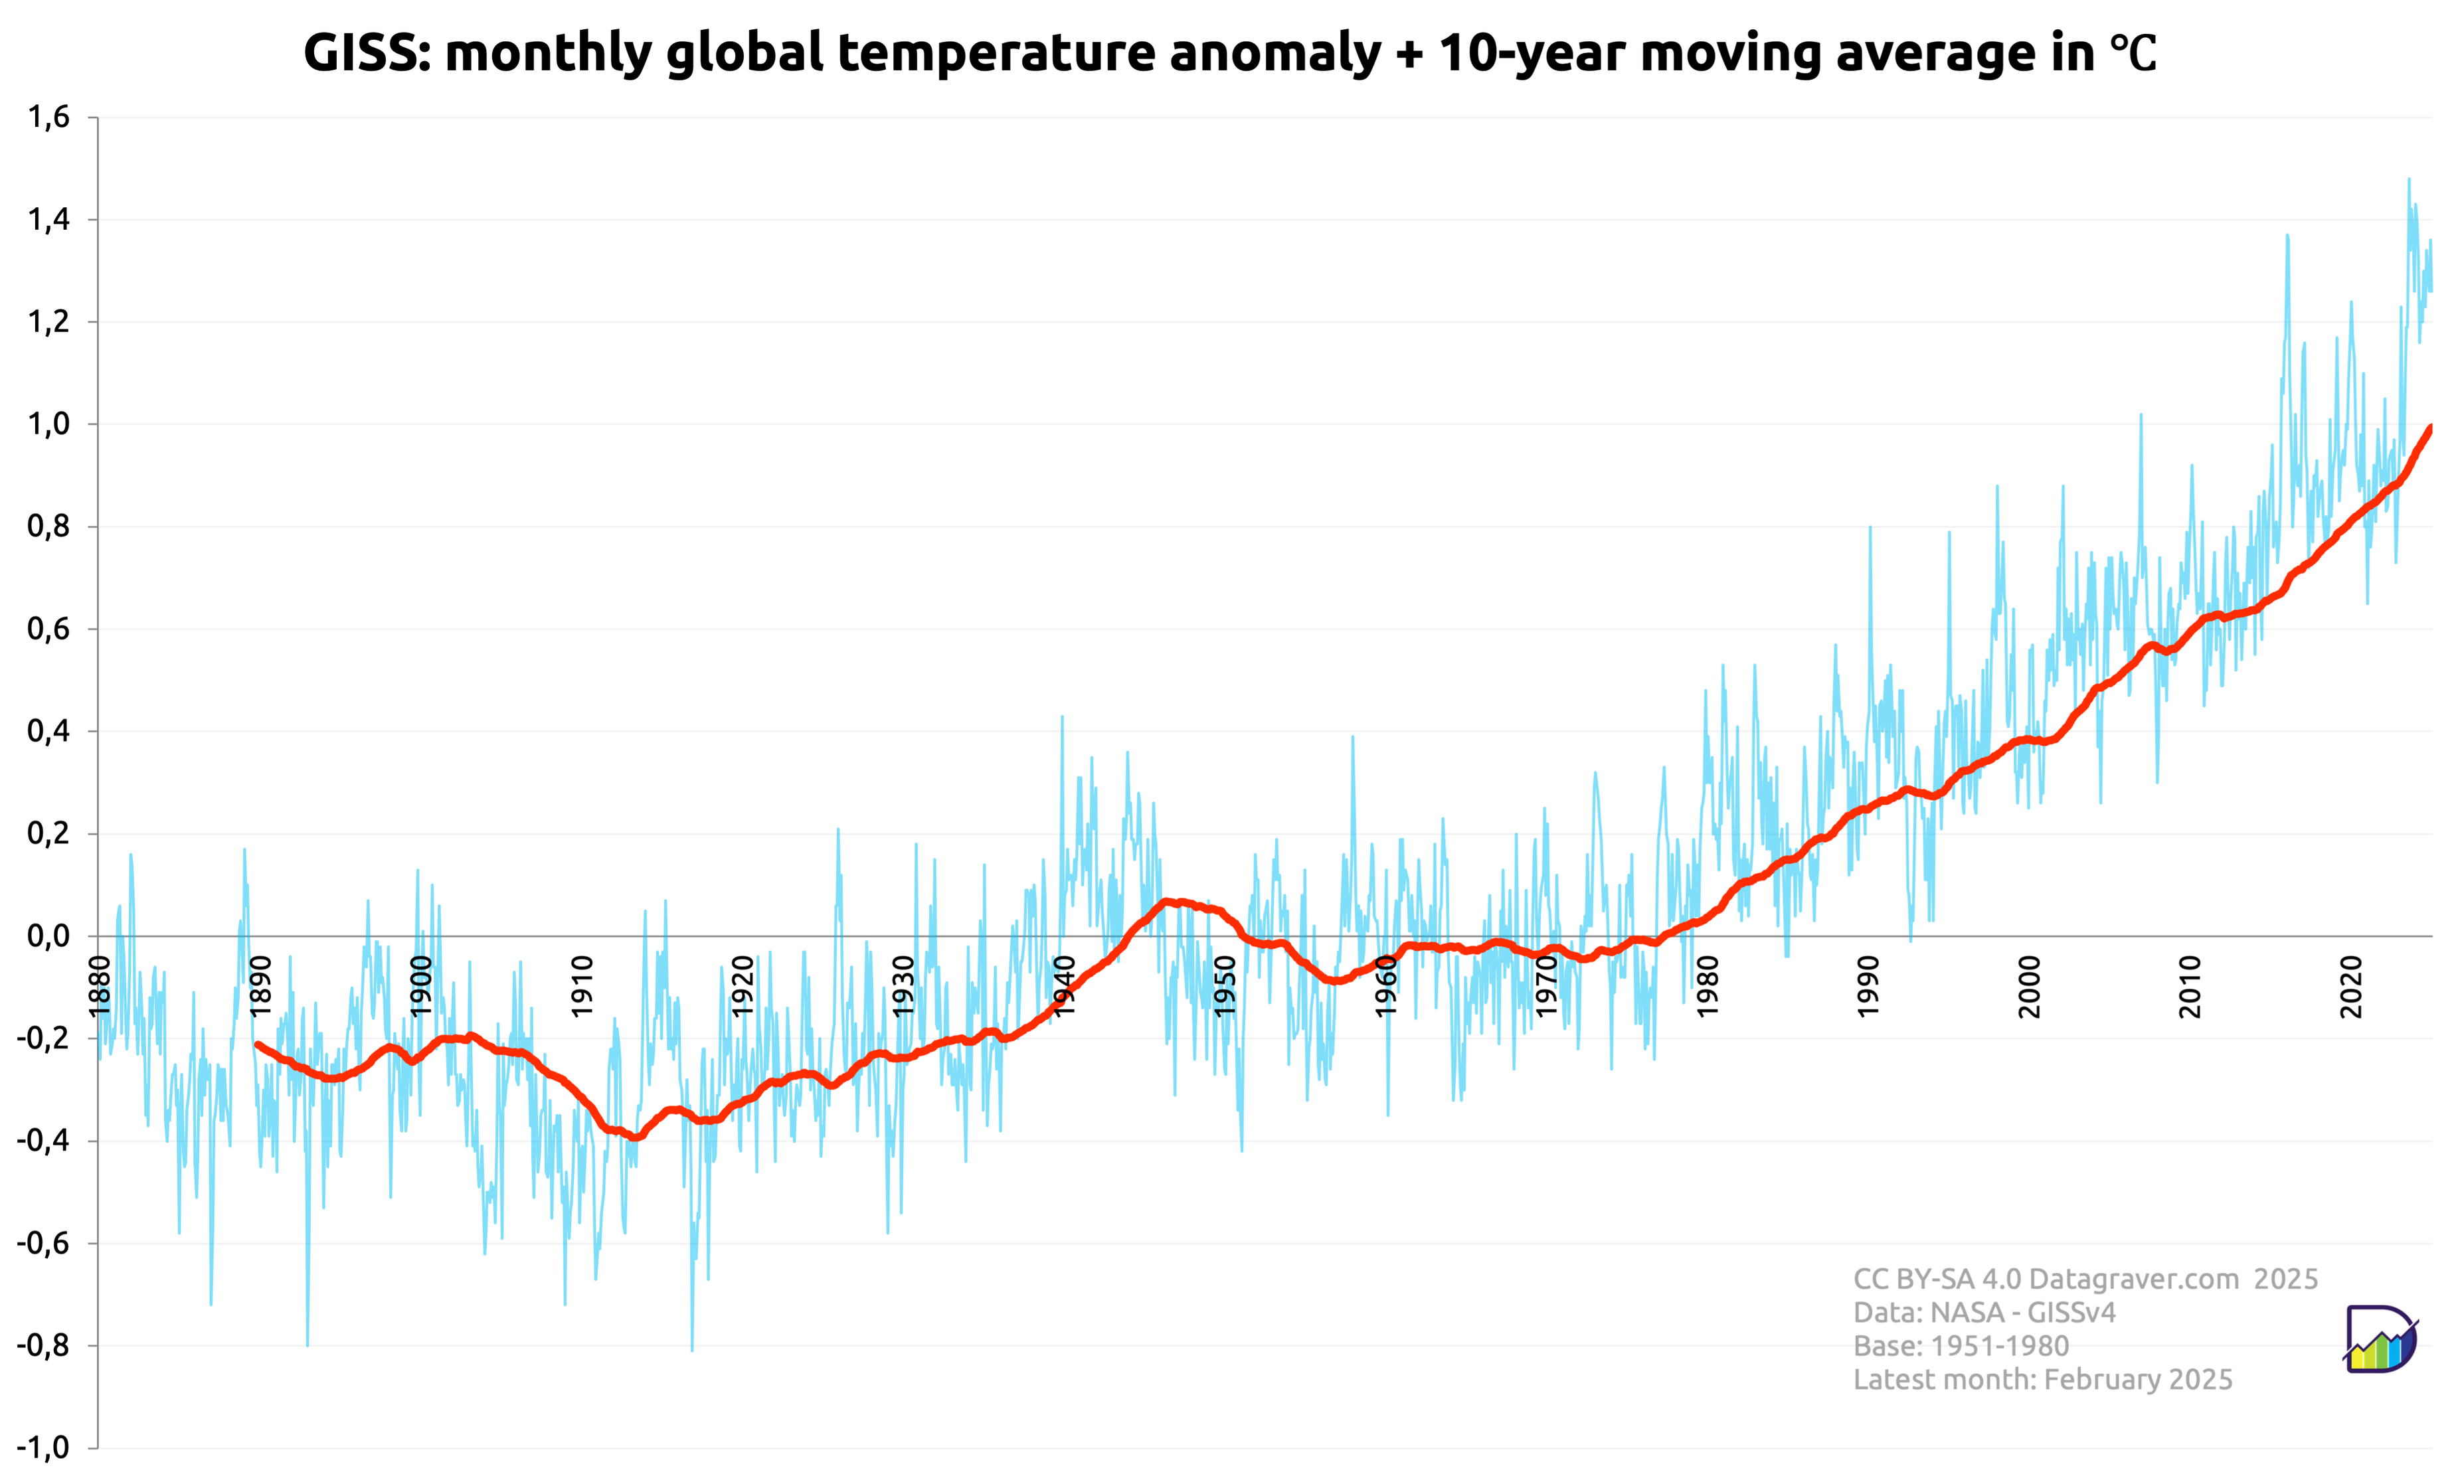
Graph with monthly world temperature anomalies as reported by NASA/GISS compared to the 1951-1980 average, since 1880, plus a 10 year moving average. This has gone from -0.3 around 1900 to +1.0 now.
https://files.mastodon.social/media_attachments/files/114/145/909/429/034/443/original/3b724c8df53f8381.png