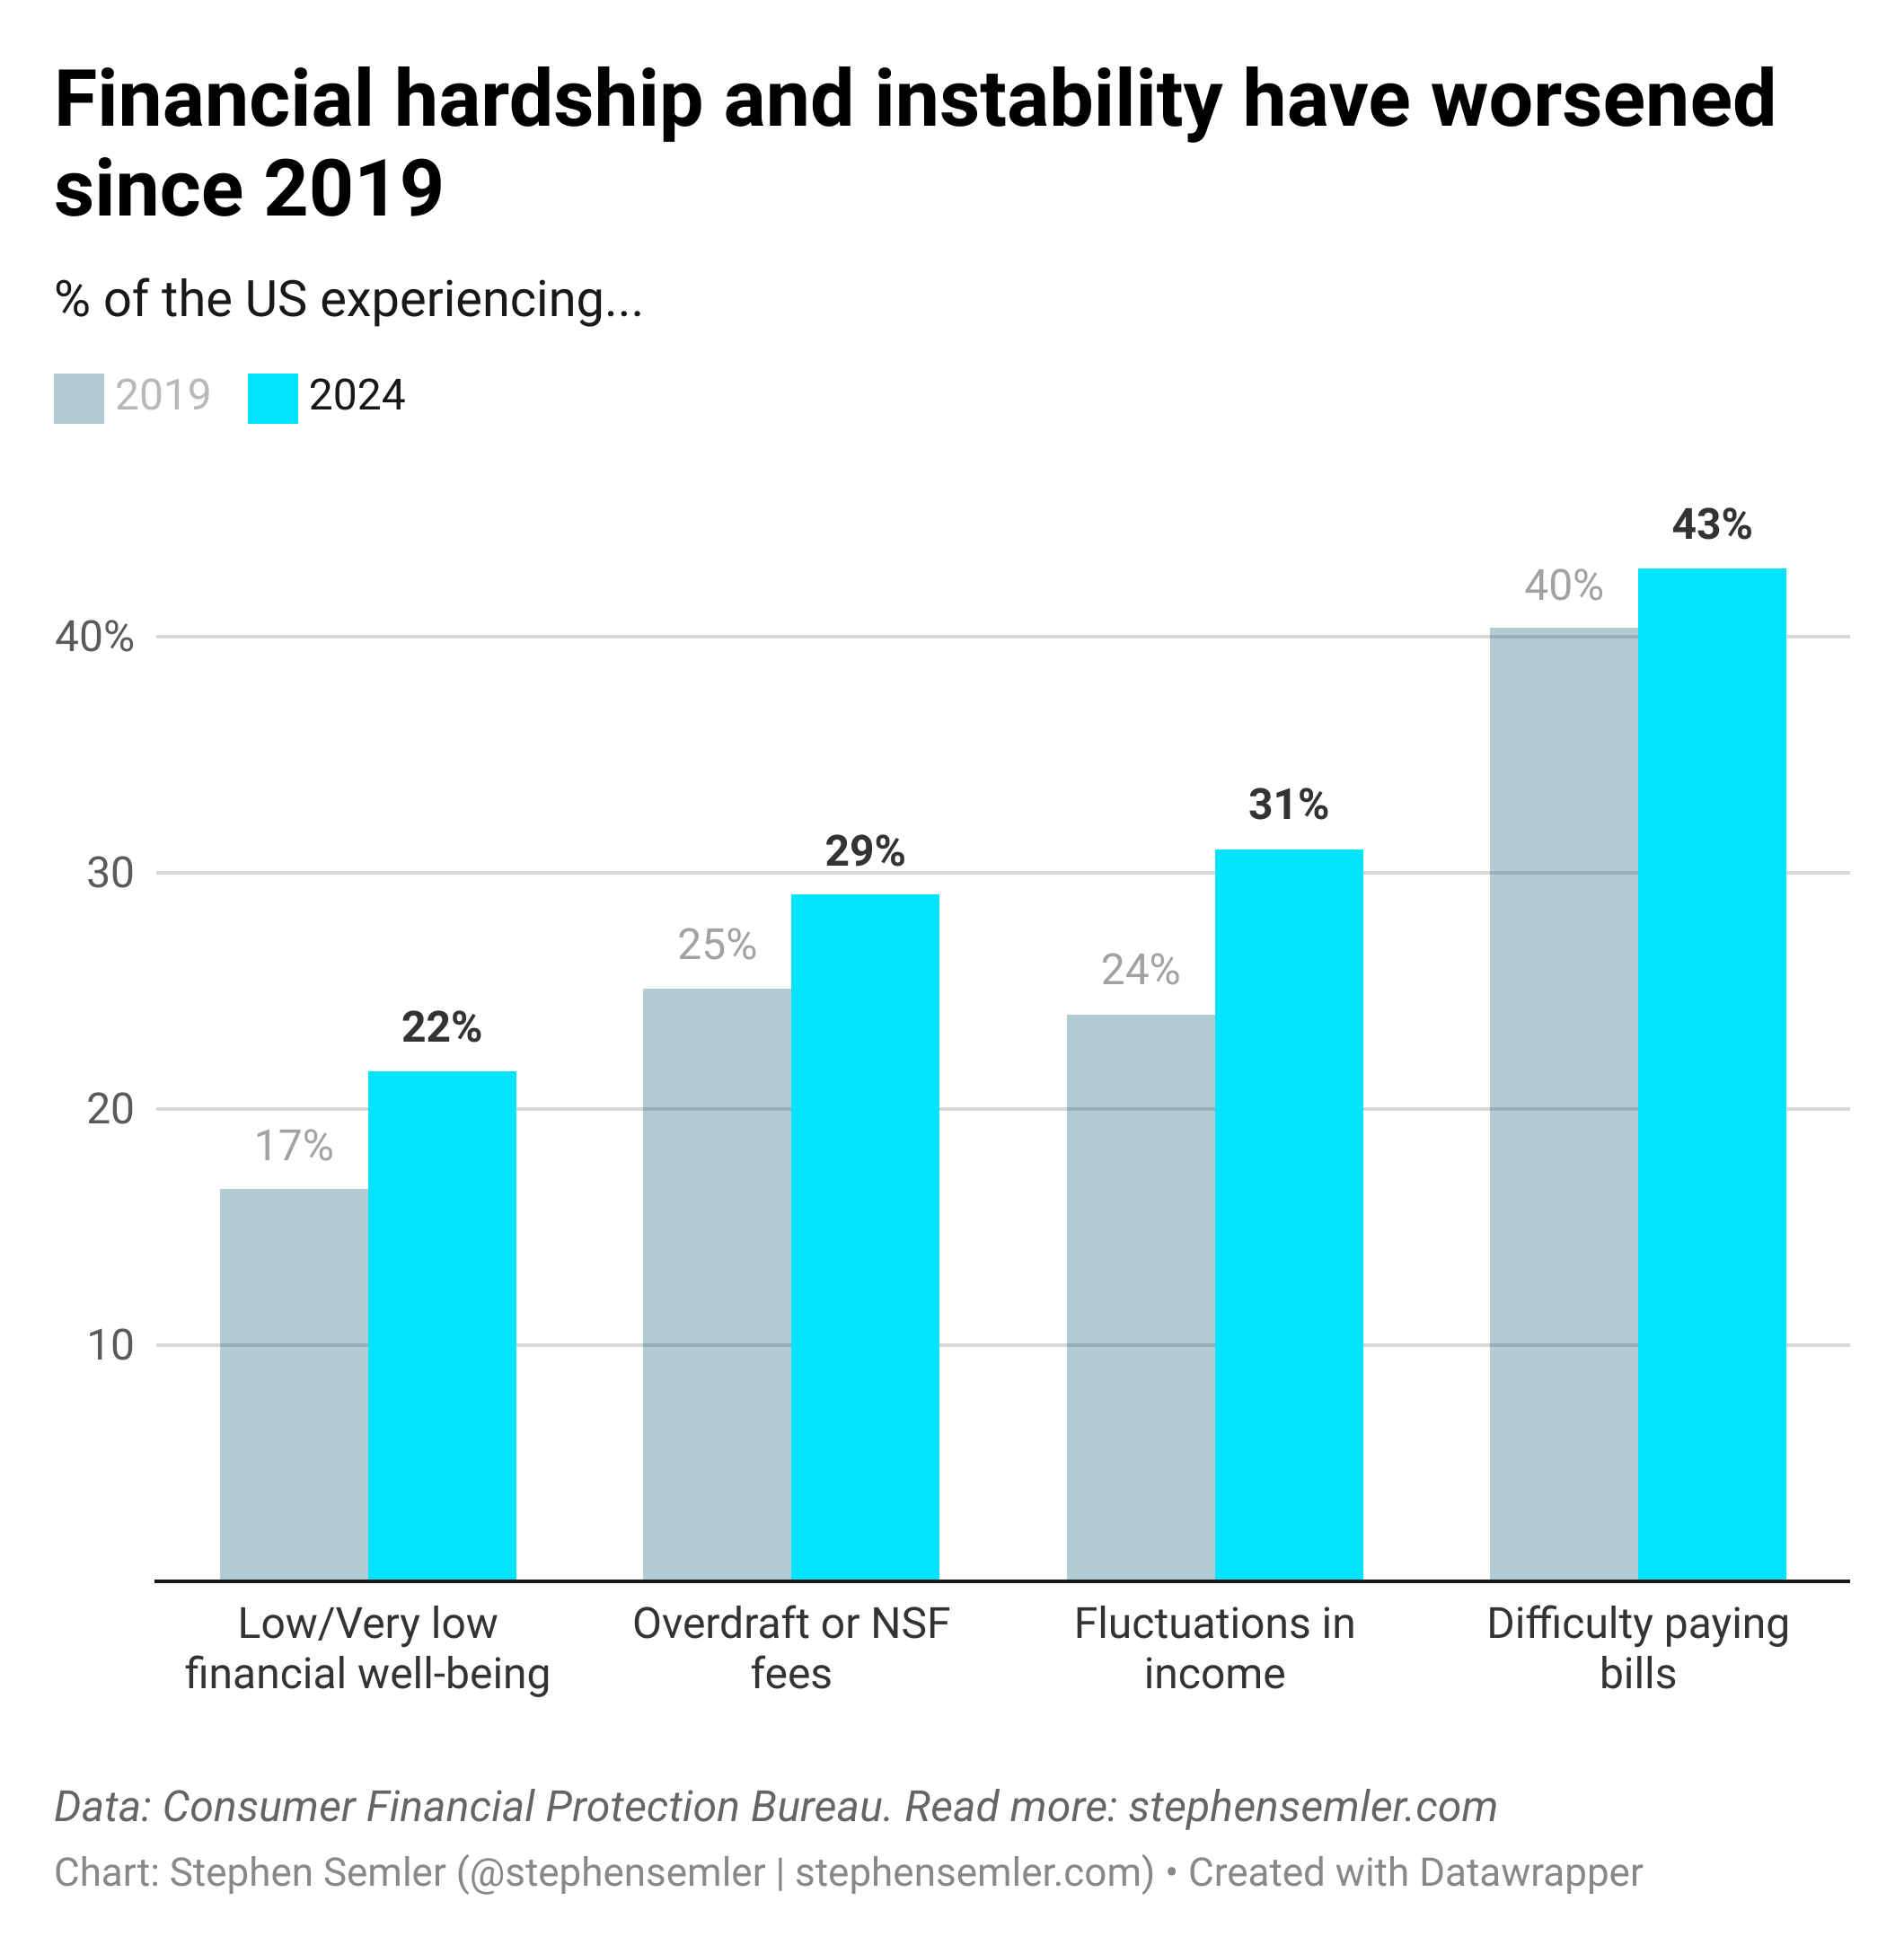
Financial hardship and instability have worsened since 2019. This graph compares 2019 and 2024 across four barometers of financial difficulty. The numbers refer to the percent of the U.S. population experiencing each difficulty. Low/very low financial well-being: 17% in 2019, 22% in 2024. Overdraft or NSF fees: 25%, 29%. Fluctuations in income: 24%, 31%. Difficulty paying bills: 40%, 43%. Data: Consumer Financial Protection Bureau.
https://files.mastodon.social/media_attachments/files/113/903/171/331/165/363/original/e94df195f9bbecd0.png