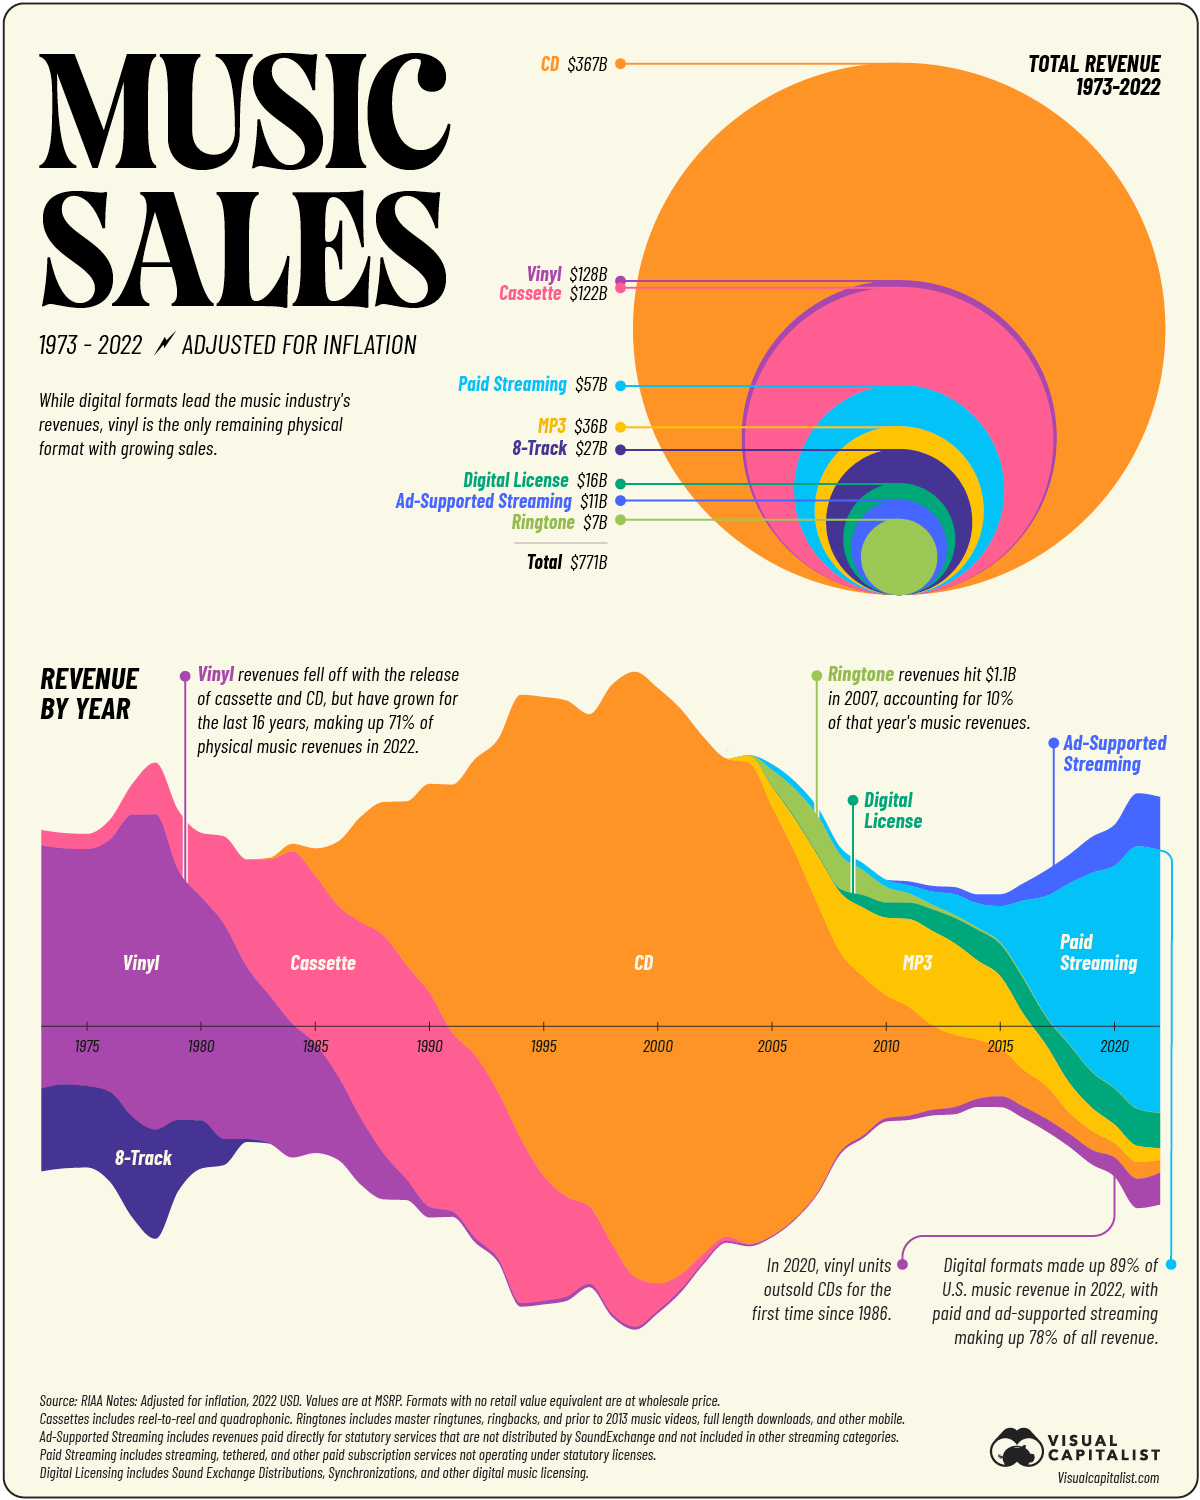
Infographic titled "Music Sales 1973-2022" showing total revenue by format. A circular chart displays relative sizes of revenue from CD ($367B), vinyl, cassette, paid streaming, and other formats. Below, a timeline graph illustrates revenue trends, highlighting the dominance of CDs, the decline of physical formats, and the rise of digital and streaming services. Notes on vinyl's resurgence and digital formats' current dominance are included.
https://cdn.masto.host/vissocial/media_attachments/files/113/884/142/098/762/607/original/c38713546b9b296c.png