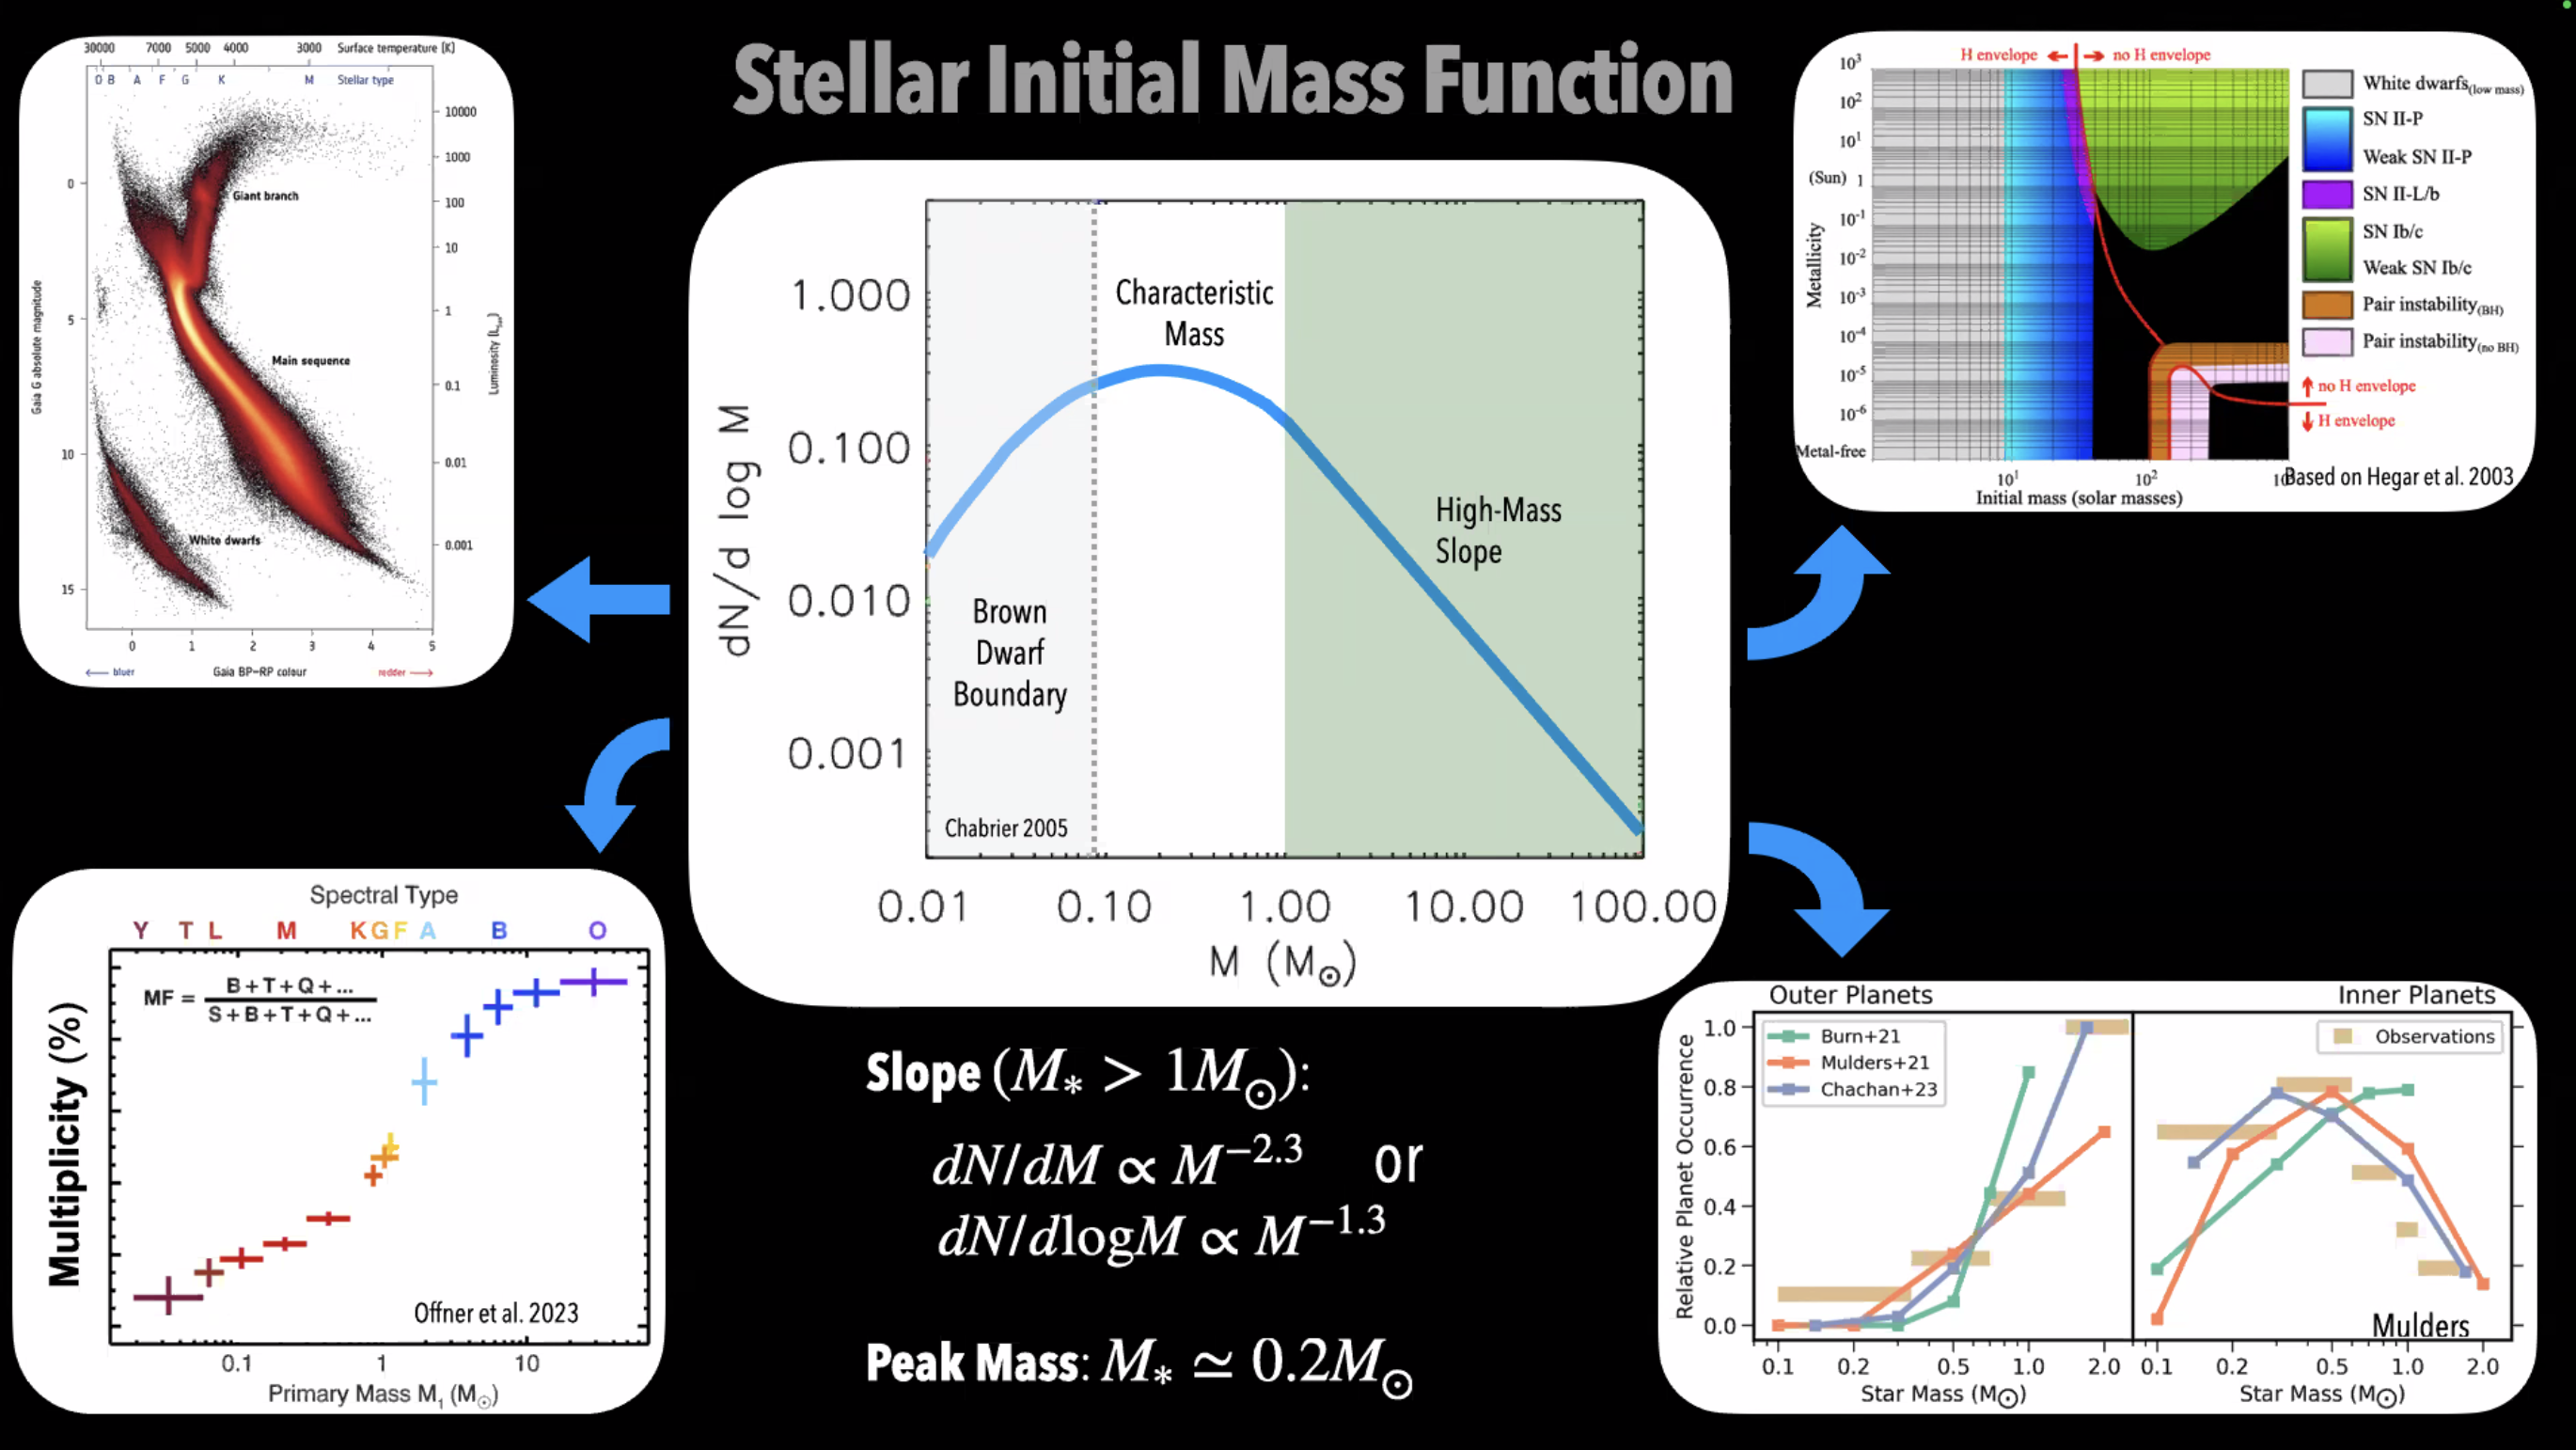
Stellar Initial Mass Function Plot of dN / d * log M vs. M (M_sun), the distribution of stars at various masses. The mass values range from 0.01 to 100 times the mass of the Sun. A line slopes upward, peaks at about 0.2 solar masses, and then slopes downward. The area between 0.01 and 0.1 solar masses is labeled "Brown Dwarf Boundary". The peak is labeled "Characteristic Mass" and the downward slope is labeled "High-Mass Slope". Slope ( M_star > 1M_sun) dN/dM proportional to M ^ - 2.3 or dN/dlogM proportional to M ^ -1.3 Peak Mass: M _star about equal to 0.2 M_sun Four graphs connect to the central graph. The first graph is a HR diagram, which sorts stars by brightness and color to show the evolutionary state of the stars, including the main sequence, giant branches, and white dwarfs. The second graph shows the multiplicity fraction of stars by primary mass or spectral type. For very low masses, the multiplicity fraction is low, meaning most stars are single stars. For very high masses, the fraction is very high, meaning more stars are in binaries or higher-order multiples. The thrid shows the ultimate fate of star by initial mass. These include white dwarfs and various types of supernovas. The fourth graph shows the relative planet occurrence by planet mass. For outer planets, the occurrence is very low for small stars and peaks at about 2.0 solar masses. For inner planets, the distribution peaks at about 0.5 solar masses, and is lower on the low-mass and high-mass end.
https://media.astrodon.social/media_attachments/files/113/852/951/575/235/129/original/c9e11a36e70337f5.png