GNU social JP
  • FAQ
  • Login
GNU social JPは日本のGNU socialサーバーです。
Usage/ToS/admin/test/Pleroma FE
  • Public

    • Public
    • Network
    • Groups
    • Featured
    • Popular
    • People

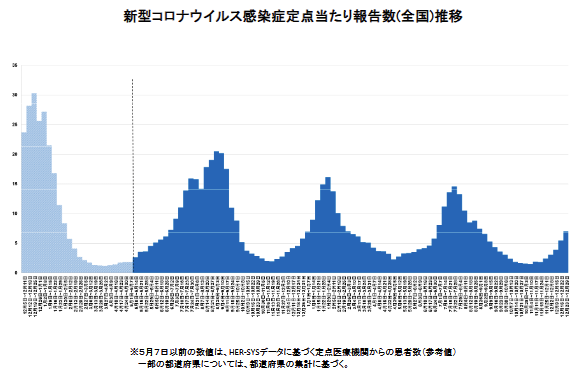
Screenshot showing graph of transition of COVID-19 patient numbers per medical facilities (nationwide for Japan, data current as of January 9, 2025) from Ministry of Health, Labor, and Welfare weekly report with vertical axis showing number of patients per medical facility for the week shown on the horizontal axis. December 23 to December 29 showed an increase to 7.01 cases per medical facility. 5th week of increases.

Download link

https://files.toad.social/media_attachments/files/113/802/551/166/394/525/original/e42d2811ef2fe96d.png

Notices where this attachment appears

  1. Embed this notice
    Minoru Saba (minorusaba@toad.social)'s status on Friday, 10-Jan-2025 15:14:34 JST Minoru Saba Minoru Saba
    in reply to

    Infection status
    Released Jan 9, 2025.
    - As of period from Dec 23 - Dec 29, 2024 -

    No. of patients per medical facility (nationwide) 7.01
    Change from prev. week +1.53
    [Source: Health-Labor-Welfare Ministry weekly report]
    https://www.mhlw.go.jp/content/001370323.pdf
    🔸5th week of increases.
    Saga at 6.36, Tokyo at 4.33, Akita at 9.37, Hokkaido at 16.8, Okinawa at 1.41, Iwate at 14.75

    #Influenza (nationwide) 64.39
    Change from prev. week +21.73
    #Oita at 104.84!!
    https://www.mhlw.go.jp/content/001370524.pdf
    #CovidIsNotOver #Japan

    In conversation about 5 months ago from toad.social permalink
  • Help
  • About
  • FAQ
  • TOS
  • Privacy
  • Source
  • Version
  • Contact

GNU social JP is a social network, courtesy of GNU social JP管理人. It runs on GNU social, version 2.0.2-dev, available under the GNU Affero General Public License.

Creative Commons Attribution 3.0 All GNU social JP content and data are available under the Creative Commons Attribution 3.0 license.