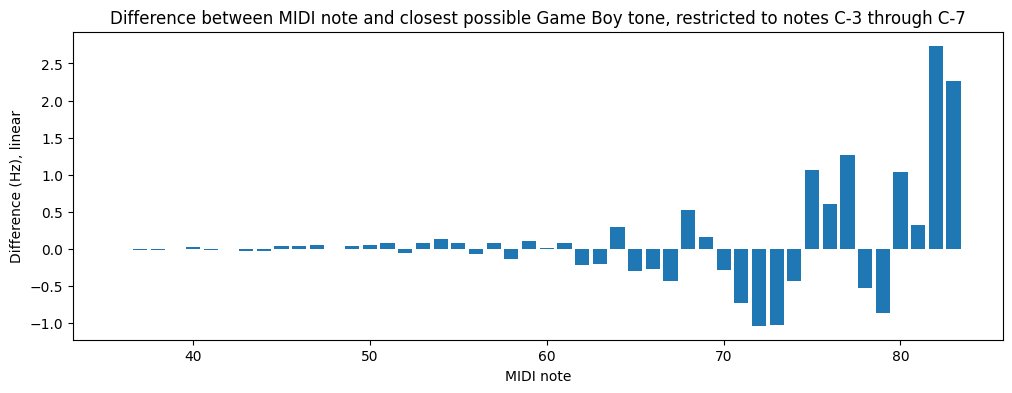
bar chart with hertz difference on the y axis and midi note on the x axis; the y axis range goes between -1 and 2.5. most of the bars are clustered around zero, but there's a larger vacillating difference toward the right side of the chart
https://friend.camp/system/media_attachments/files/113/794/370/845/655/411/original/ef718af32a552fde.png