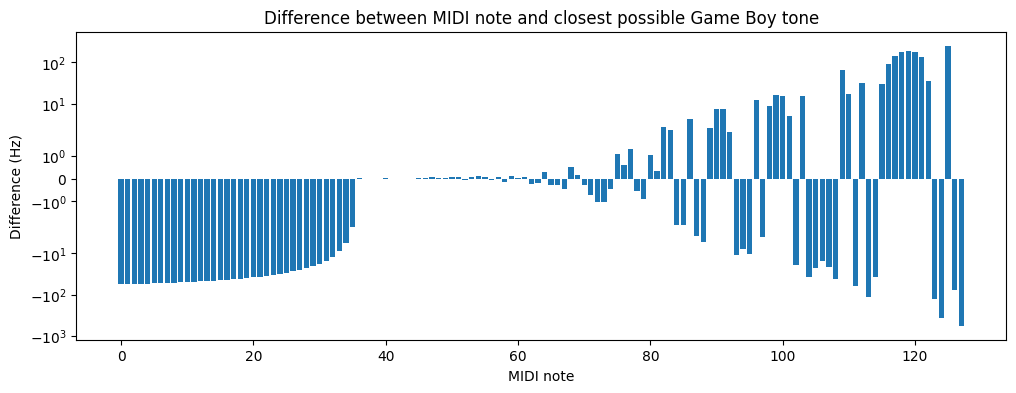
bar chart with a symmetrical log scale, with difference in hertz as the y axis and midi note as the x axis. the chart starts out with a big bump under zero, and then starts going up and down, with small amplitude at first, but then very large amplitude by the end
https://friend.camp/system/media_attachments/files/113/794/347/131/294/924/original/fc361b60d35a6835.png