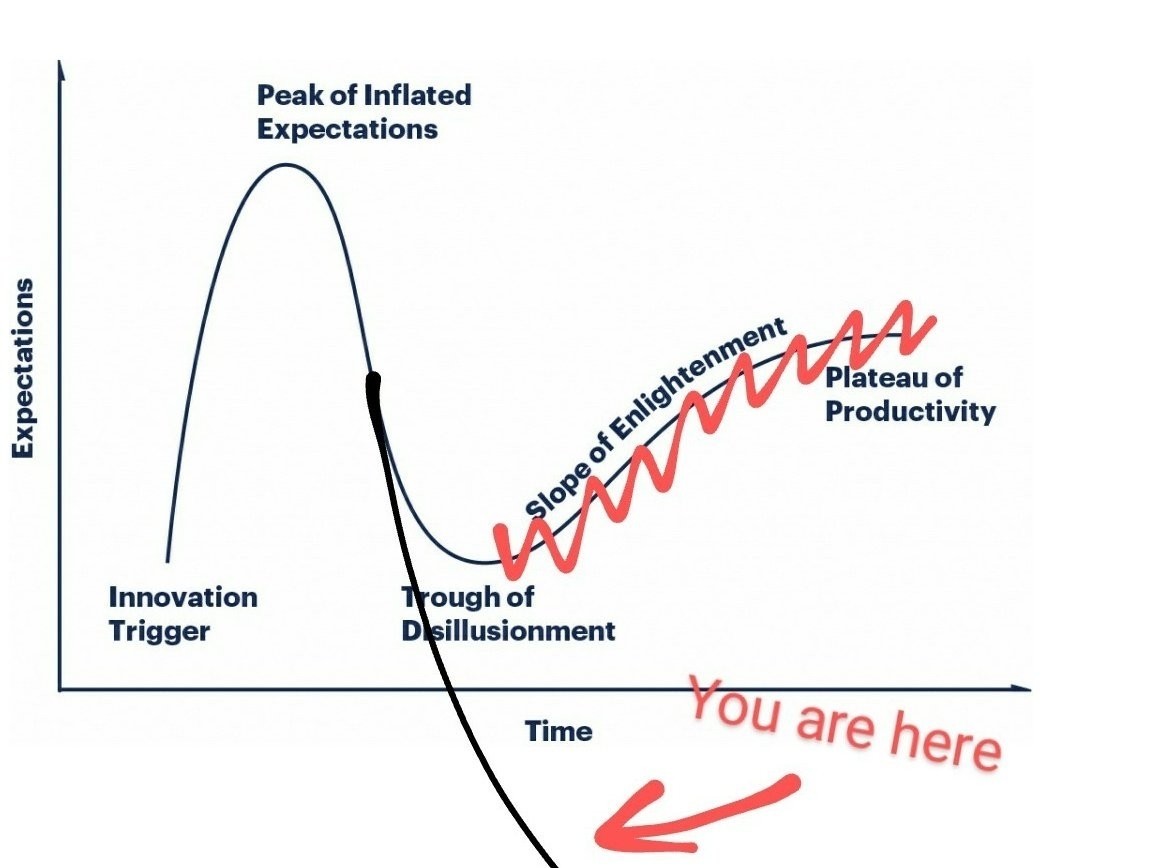
The Gartner Hype Cycle chart showing time on the x axis, expectations on y. starting from a point named "innovation trigger" the expectations rise quickly and high to the "peak of inflated expectations", then drop as sharply to the "through of disillusionment". finally it slowly levels out over time to normal expectations via the "slope of enlightenment" to the "plateau of productivity" the "slope of enlightenment" is crossed out with a squiggly red line. Instead a sloppily added line continues to drop way below the x axis. It's labeled "You are here"
https://f2.tchncs.de/media_attachments/files/113/769/741/280/931/276/original/1c79b8ddc836d800.jpg