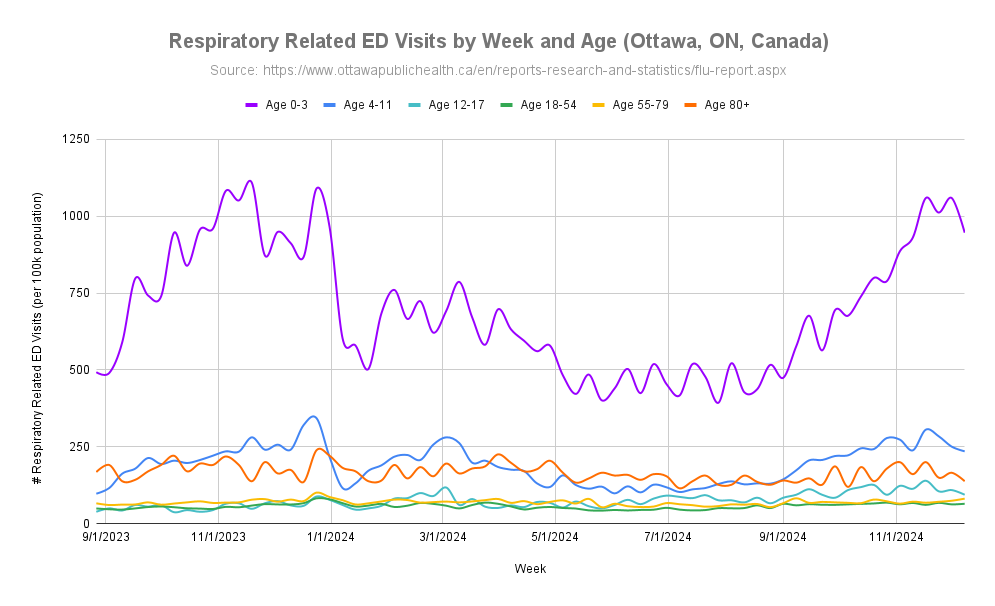
Chart of Respiratory Related ED Visits by Week and Age (Ottawa, ON, Canada) with population rate per 100K
https://static.mstdn.science/media_attachments/files/113/694/071/495/861/297/original/60054784c15dfeaa.png
But you aren't seeing the full picture, this is where population rate comes in. The next graph uses the same data but instead of raw numbers shows the rate per 100,000 population in each age group.
You can see with population rate the age 0-3 group is far and above the highest level of all groups while the 18-54 age group which had similar raw numbers is actually the lowest rate. 4/
GNU social JP is a social network, courtesy of GNU social JP管理人. It runs on GNU social, version 2.0.2-dev, available under the GNU Affero General Public License.
![]() All GNU social JP content and data are available under the Creative Commons Attribution 3.0 license.
All GNU social JP content and data are available under the Creative Commons Attribution 3.0 license.