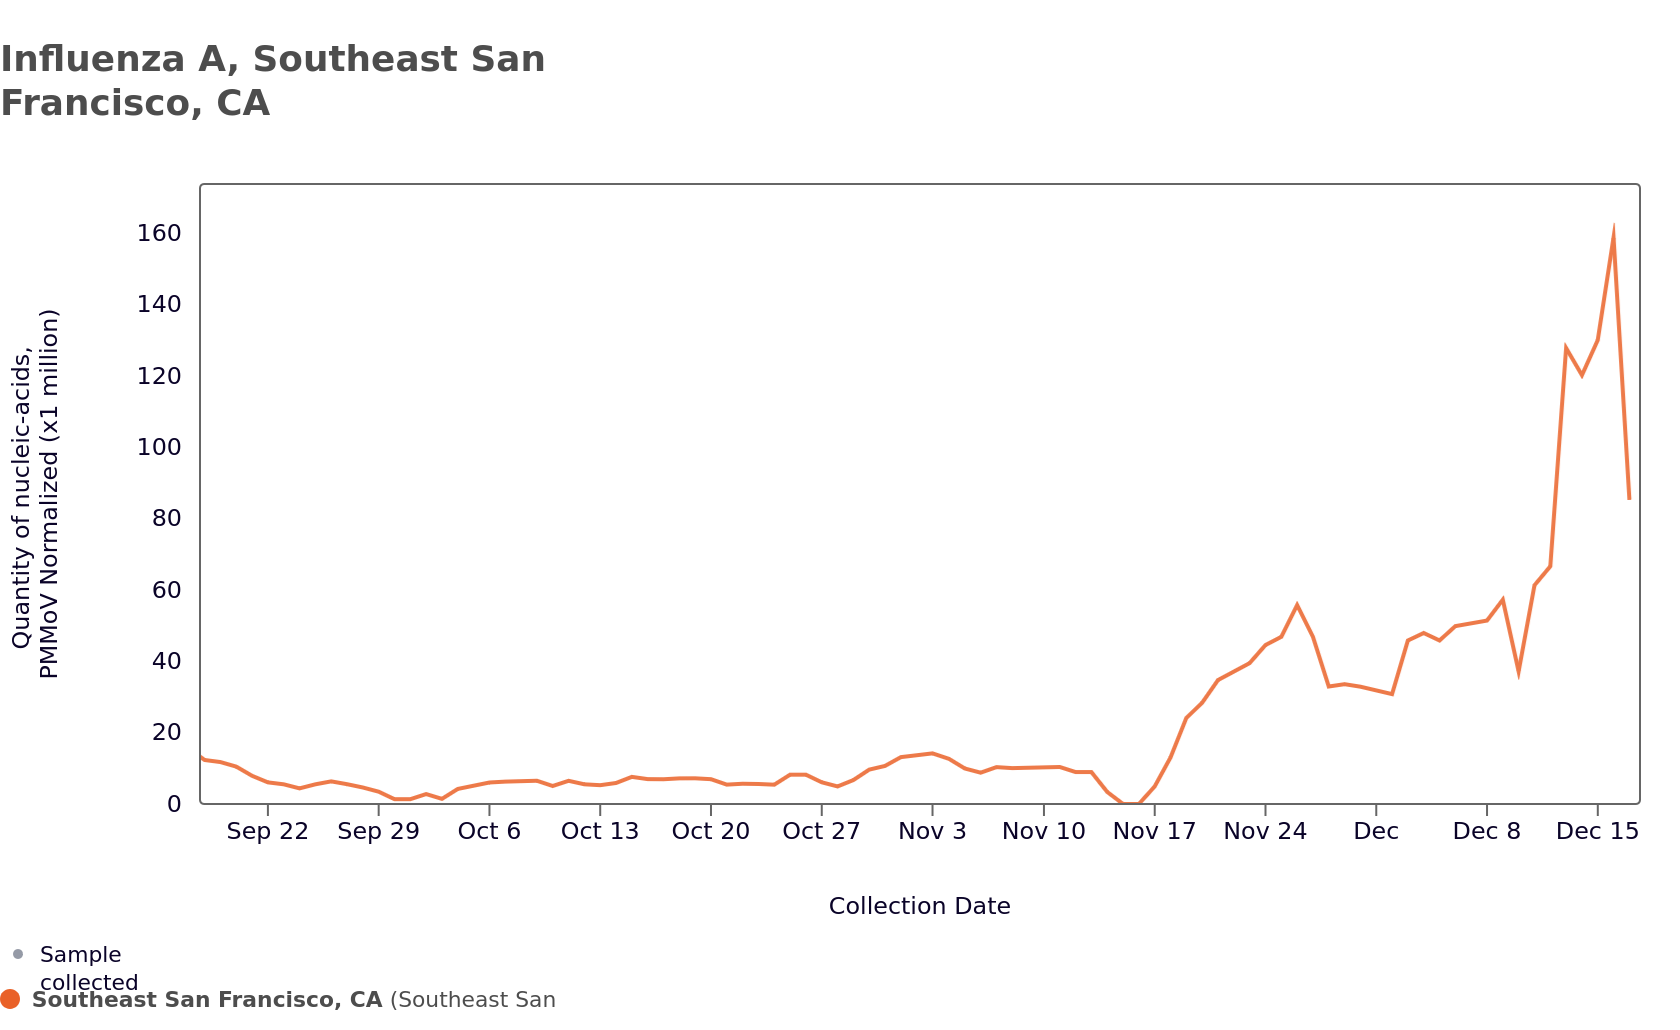
Chart of Influenza A in Southeast San Francisco, CA, quantity of nucleic acids, PMMoV Normalized (x1 million). Numbers consistently below 20 from September (when the chart begins) to November 17, then a spike, then a really big spike around December 12, peaking so far at 160.
https://s3-us-west-1.amazonaws.com/carfreecitymain/media_attachments/files/113/677/692/042/328/727/original/80214fa368c54f53.png