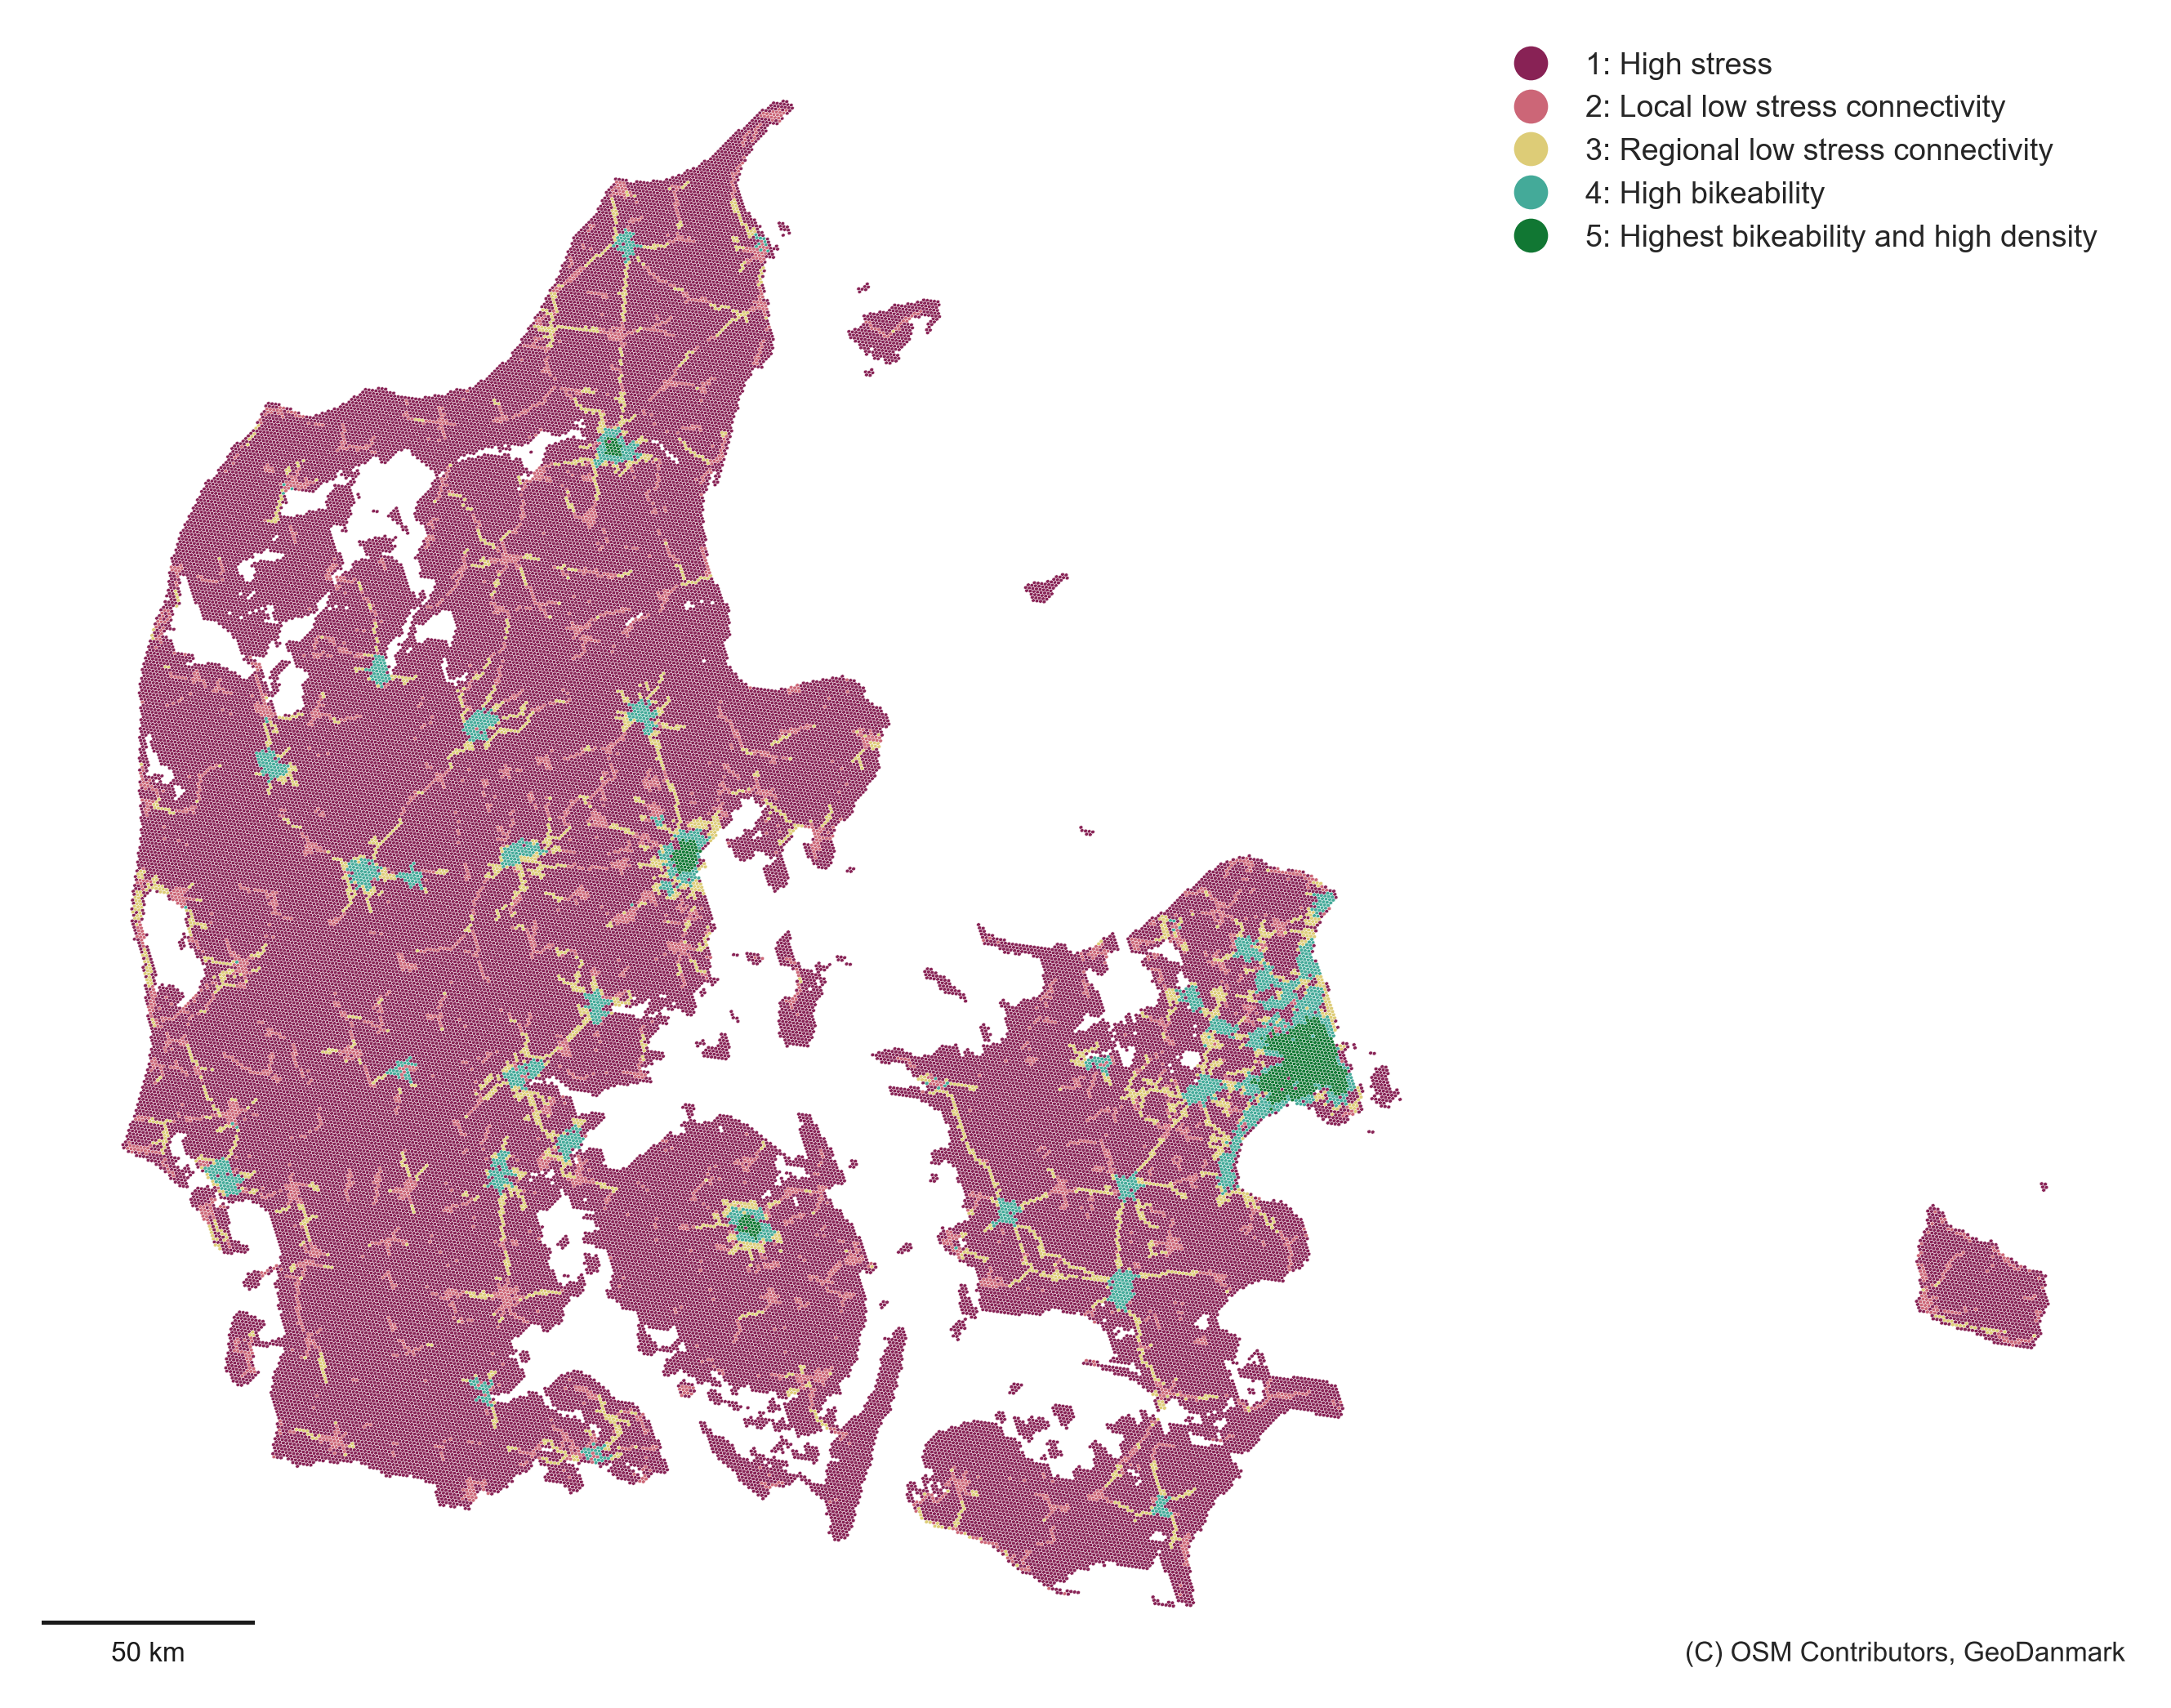
Map of Denmark aggregated into small hex units, each showing one of five colors (categories), from high stress to highest bikeability+high density. The map shows highest bikeability in cities, some regional low stress connectivity, and high stress in most rural areas.
https://sb-82bx3xp8al.b-cdn.net/media_attachments/files/113/633/714/149/299/579/original/fabe8853cc37f06b.png