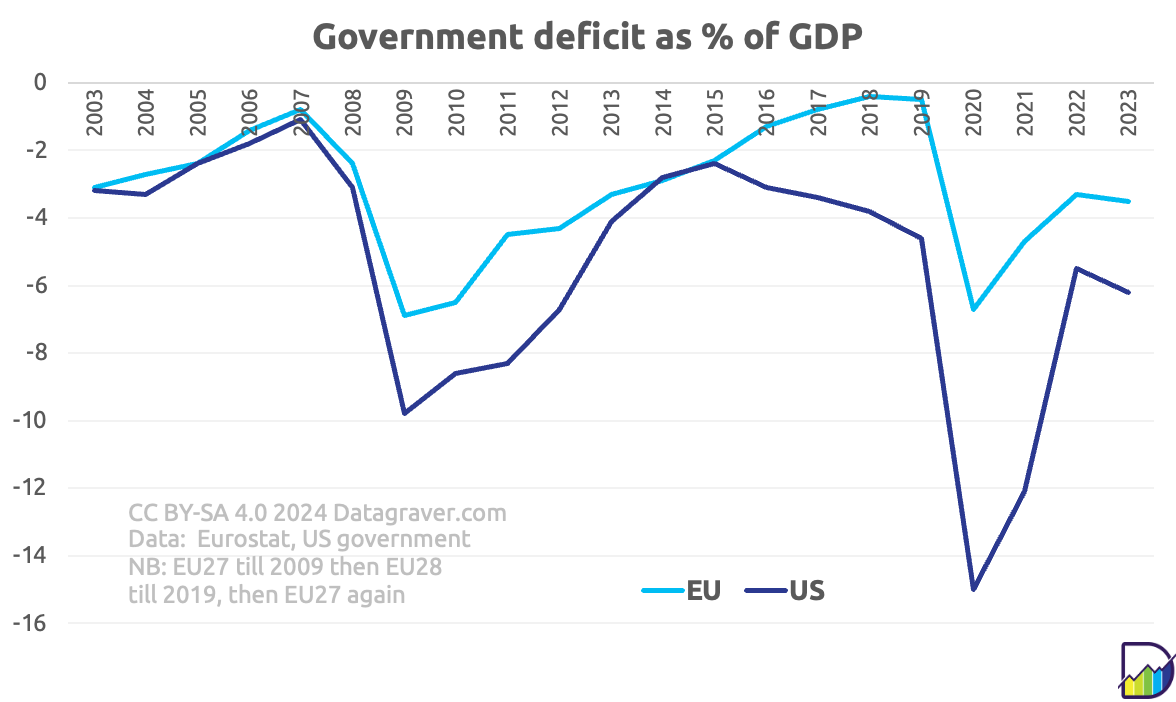
Graph showing government deficit as % of GDP for EU versus USA per year since 2003. Data: Year EU US 2003 3,1 3,2 2004 2,7 3,3 2005 2,4 2,4 2006 1,4 1,8 2007 0,8 1,1 2008 2,4 3,1 2009 6,9 9,8 2010 6,5 8,6 2011 4,5 8,3 2012 4,3 6,7 2013 3,3 4,1 2014 2,9 2,8 2015 2,3 2,4 2016 1,3 3,1 2017 0,8 3,4 2018 0,4 3,8 2019 0,5 4,6 2020 6,7 15 2021 4,7 12,1 2022 3,3 5,5 2022 3,5 6,2
https://files.mastodon.social/media_attachments/files/113/571/018/298/300/776/original/4002ba2addf9dccc.png