GNU social JP
  • FAQ
  • Login
GNU social JPは日本のGNU socialサーバーです。
Usage/ToS/admin/test/Pleroma FE
  • Public

    • Public
    • Network
    • Groups
    • Featured
    • Popular
    • People

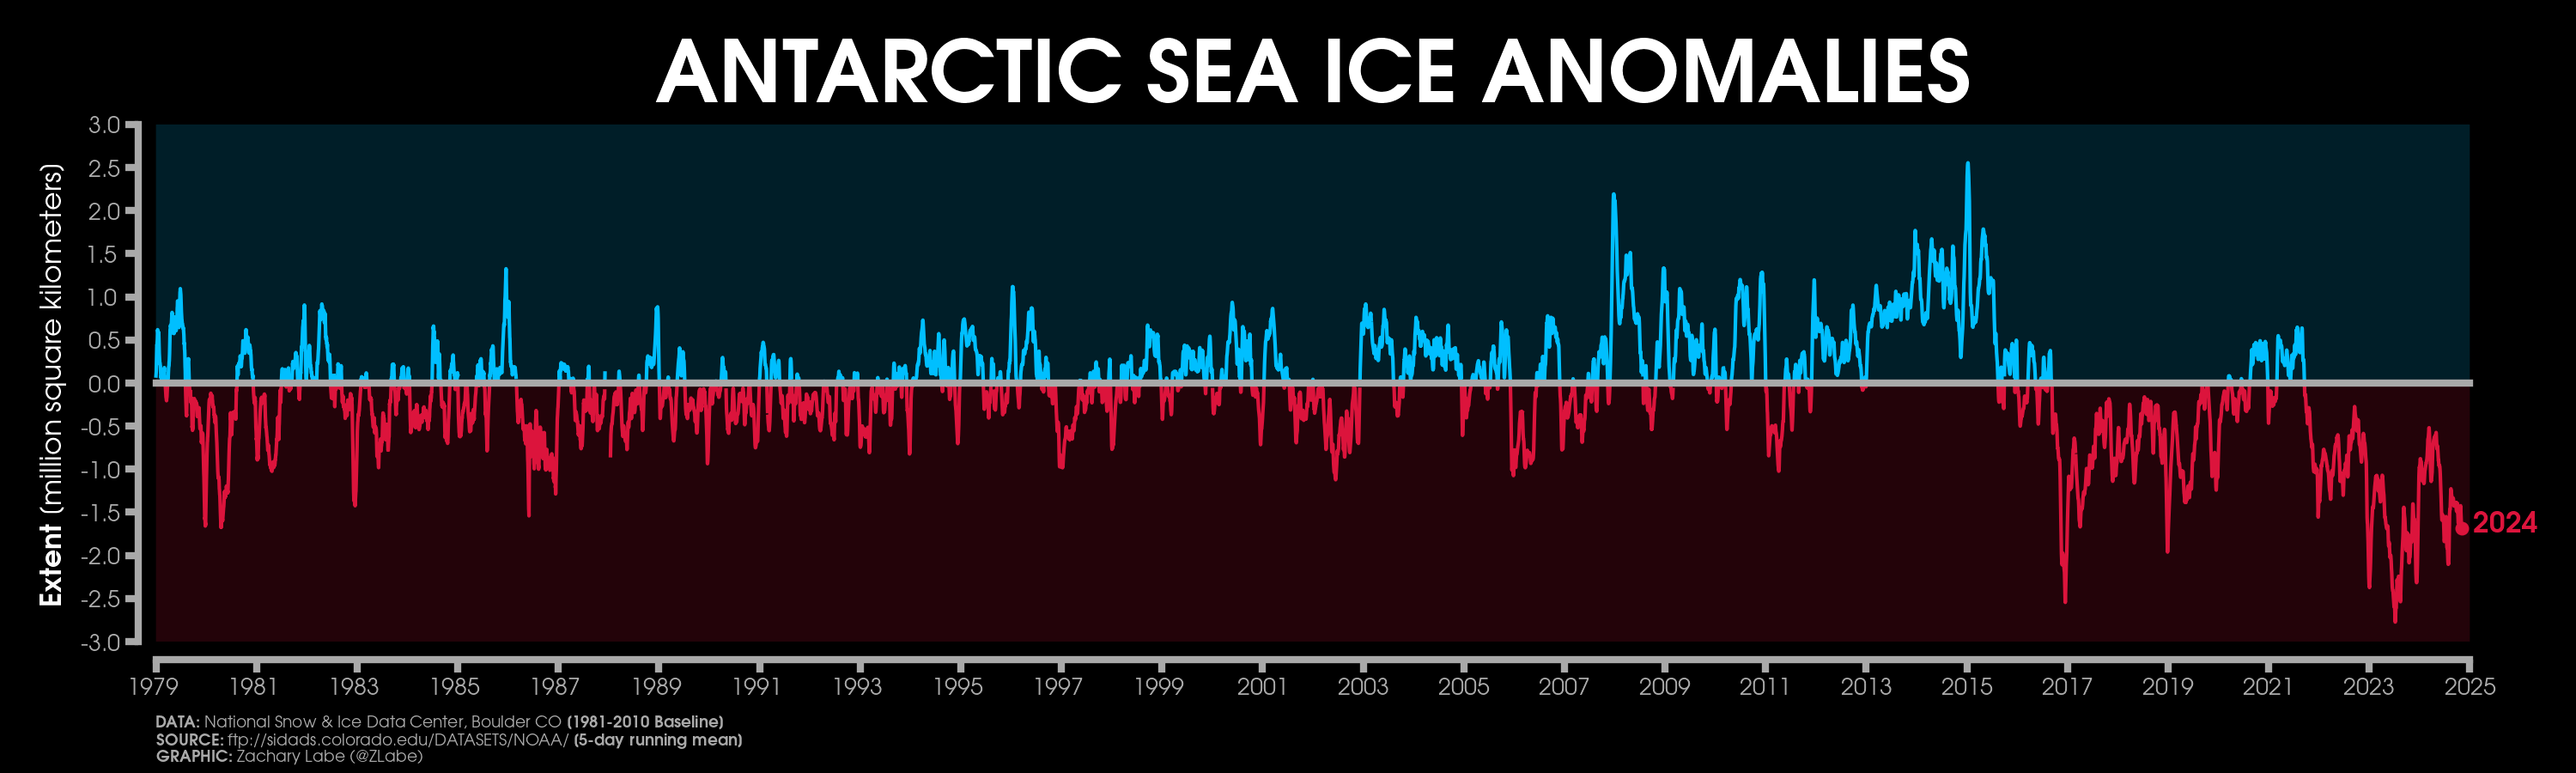
Graph of antarctic sea ice anomalies, from 1979 to 2024. It varies in a jagged and highly irregular fashion, with vertical excursions as high as positive 2.5 million square kilometres, and as low as negative 2.5 million square kilometres, but from 1979 to late 2016, there is little to no trend. Then, in late 2016, there is a sharp step-change, a near-vertical drop of around 2.5 million square kilometres. Then the line resumes its prior highly jagged, seemingly trendless behavior, but about 1.5 million square kilometres lower than before.

Download link

https://cdn.masto.host/sauropodswin/media_attachments/files/113/430/009/534/259/242/original/b7f5f4408c7635a7.png

Notices where this attachment appears

  1. Embed this notice
    llewelly (llewelly@sauropods.win)'s status on Tuesday, 05-Nov-2024 20:32:38 JST llewelly llewelly

    every now and then, I look at this graph, and think about how, for decades, from 1979 until the boreal fall, or austral spring, of 2016, antarctic sea ice just seemed to ignore global warming, showing no trend. Then, suddenly, as the end of 2016 and the southern hemisphere summer approached, *clunk* antarctic sea ice fell down, and did not get up.

    graph by @ZLabe , from https://zacklabe.com/antarctic-sea-ice-extentconcentration/

    #ice
    #globalWarming
    #seaIce
    #Antarctic
    #AntarcticSeaIce
    #climate

    In conversation about 6 months ago from sauropods.win permalink
  • Help
  • About
  • FAQ
  • TOS
  • Privacy
  • Source
  • Version
  • Contact

GNU social JP is a social network, courtesy of GNU social JP管理人. It runs on GNU social, version 2.0.2-dev, available under the GNU Affero General Public License.

Creative Commons Attribution 3.0 All GNU social JP content and data are available under the Creative Commons Attribution 3.0 license.