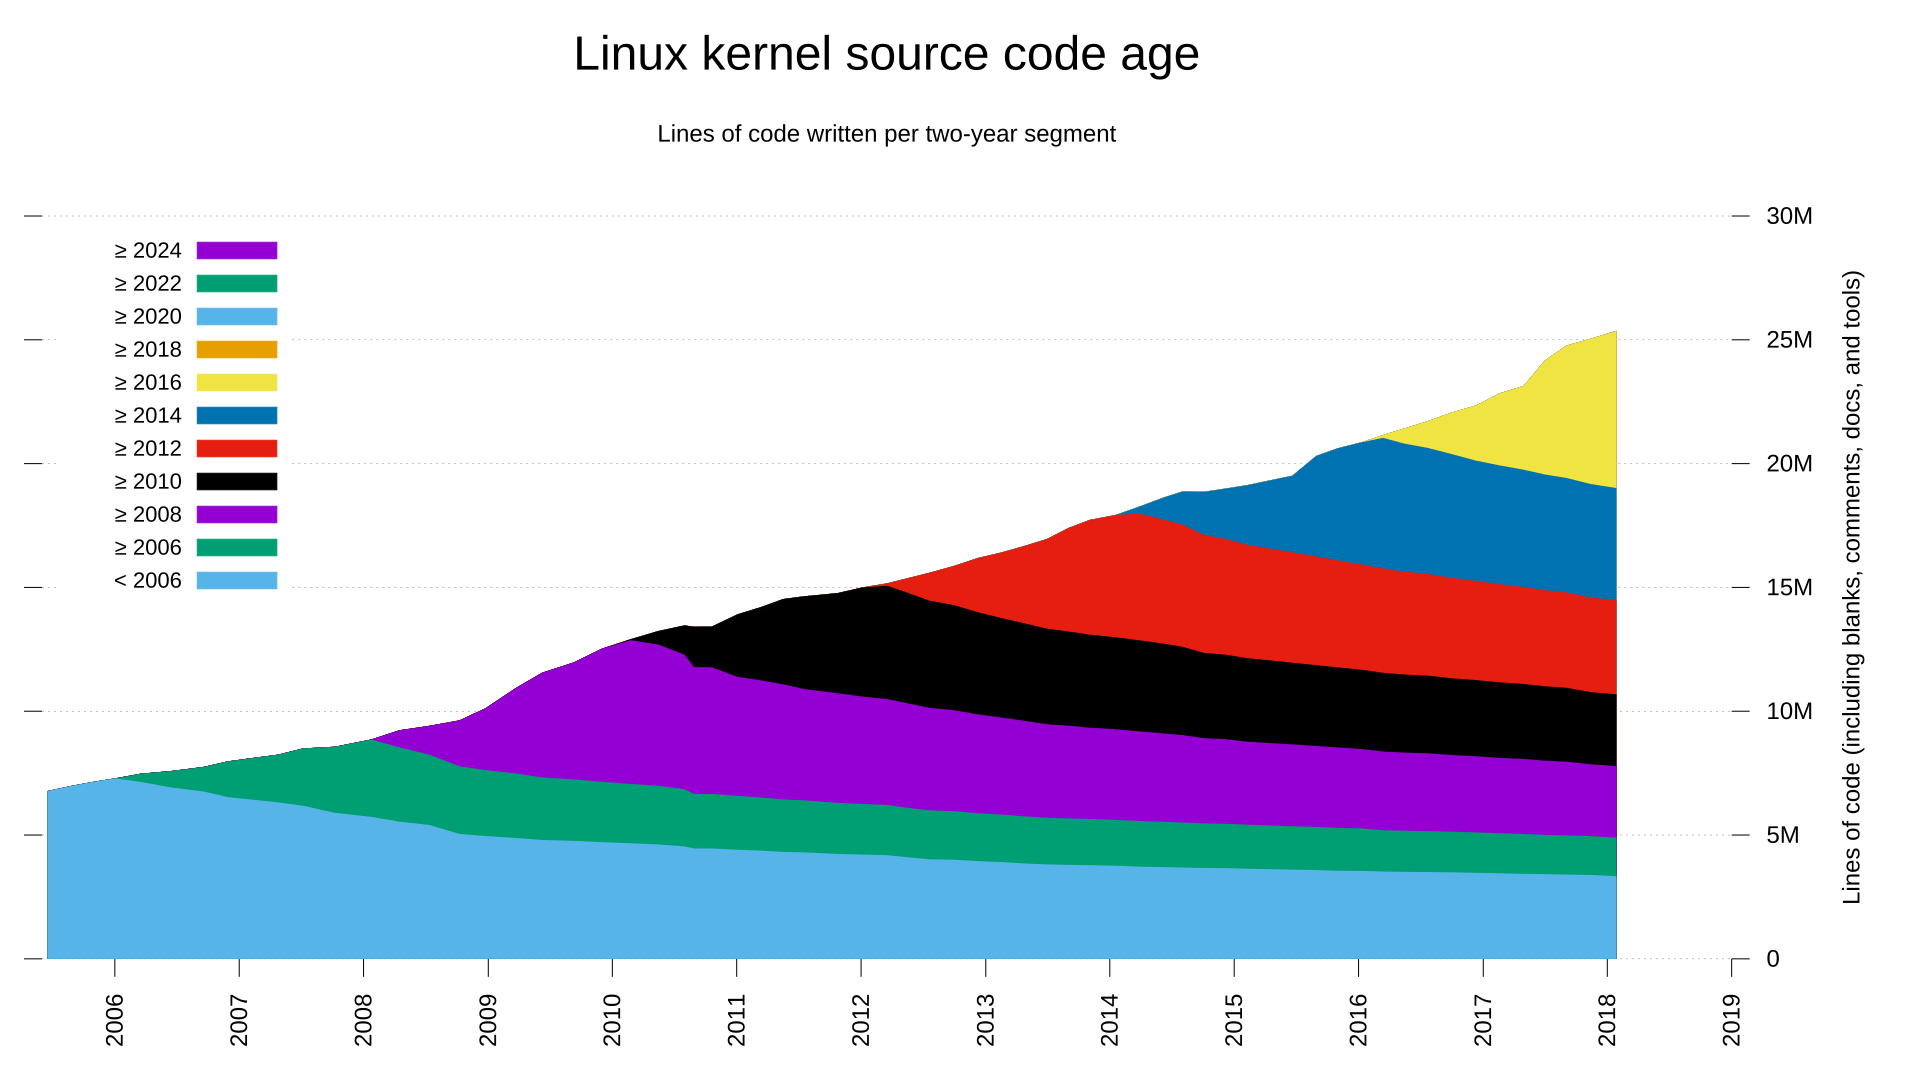
Graph of age of Linux kernel code over time. Graph rises steadily up and to the right, topping out at 20M lines of code, from 2006 through 2018, with bands of color that diminish in thickness over time. A bit more than half of each color (i.e. new lines of code) remains in 2018 compared to when it was introduced for their respective years.
https://cdn.fosstodon.org/media_attachments/files/113/404/446/770/300/967/original/19aced2428a74ea3.png