GNU social JP
  • FAQ
  • Login
GNU social JPは日本のGNU socialサーバーです。
Usage/ToS/admin/test/Pleroma FE
  • Public

    • Public
    • Network
    • Groups
    • Featured
    • Popular
    • People

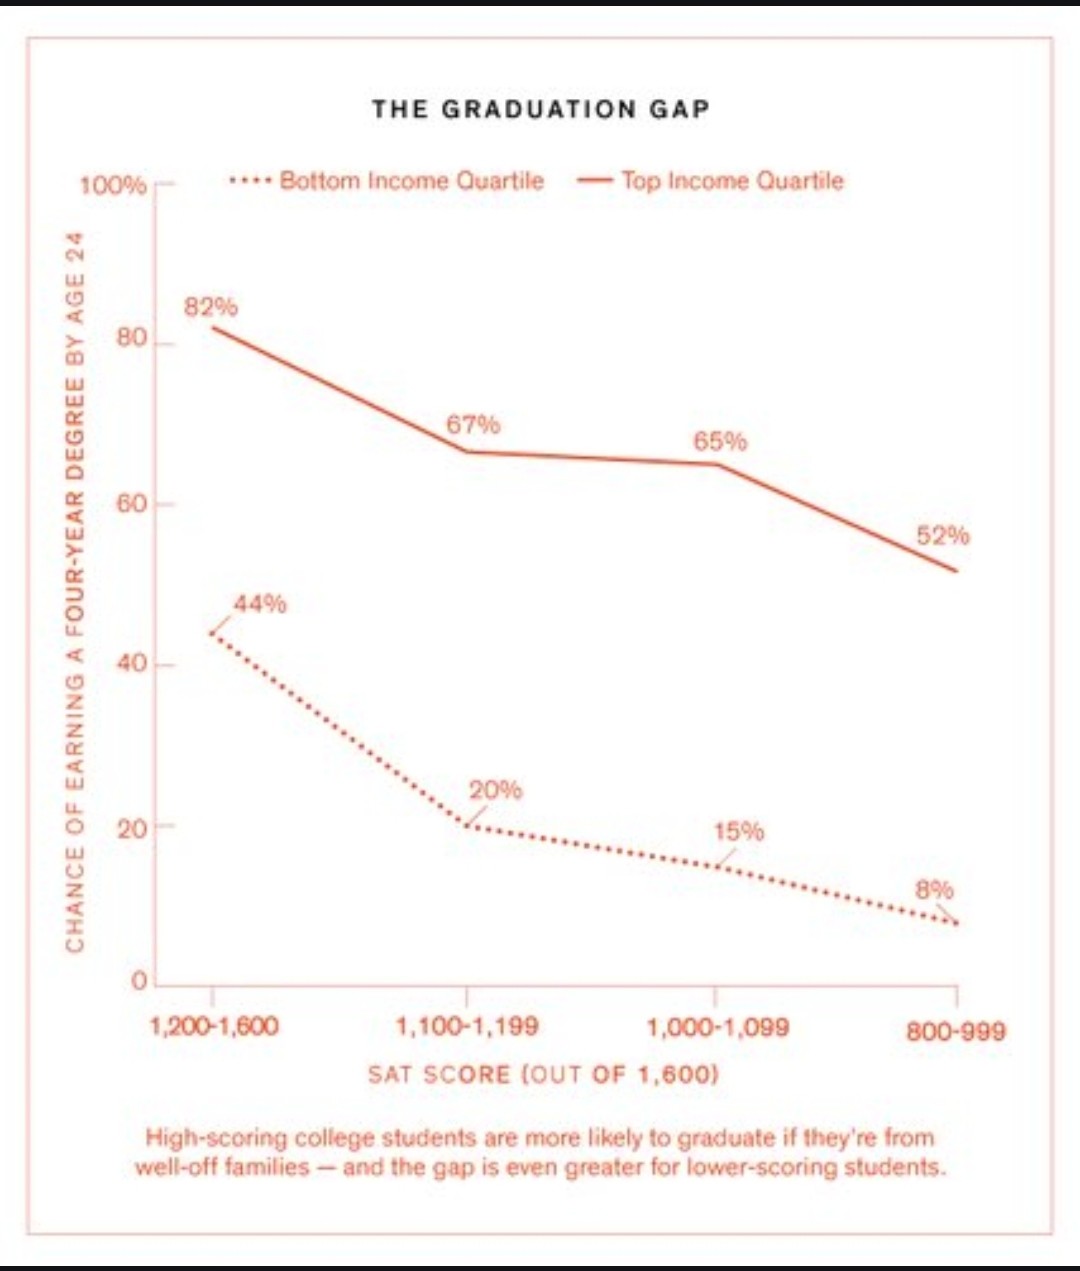
Graph titled The Graduation Gap Y axis - chance of achieving a 4-year degree (0-100% X axis - SAT scores (1600-800 - left to right) There are two lines on the graph. One representing top income quartile and the other representing bottom income quartile. The graph indicates that students from the top income group who fared poorly on their SATs are still more likely to receive a degree than students from the bottom income group who did well on the SATs.

Download link

https://s3.eu-central-2.wasabisys.com/mastodonworld/media_attachments/files/113/249/538/885/433/772/original/981f4e65453428fe.jpg

Notices where this attachment appears

  1. Embed this notice
    Sheeb (shebeencounter@mastodon.world)'s status on Saturday, 05-Oct-2024 10:43:00 JST Sheeb Sheeb

    @mekkaokereke always loved this graph demonstrating how wealthy, 'bad' students are for more likely to graduate from college than non-wealthy, 'good' students.

    In conversation about 9 months ago from mastodon.world permalink
  • Help
  • About
  • FAQ
  • TOS
  • Privacy
  • Source
  • Version
  • Contact

GNU social JP is a social network, courtesy of GNU social JP管理人. It runs on GNU social, version 2.0.2-dev, available under the GNU Affero General Public License.

Creative Commons Attribution 3.0 All GNU social JP content and data are available under the Creative Commons Attribution 3.0 license.