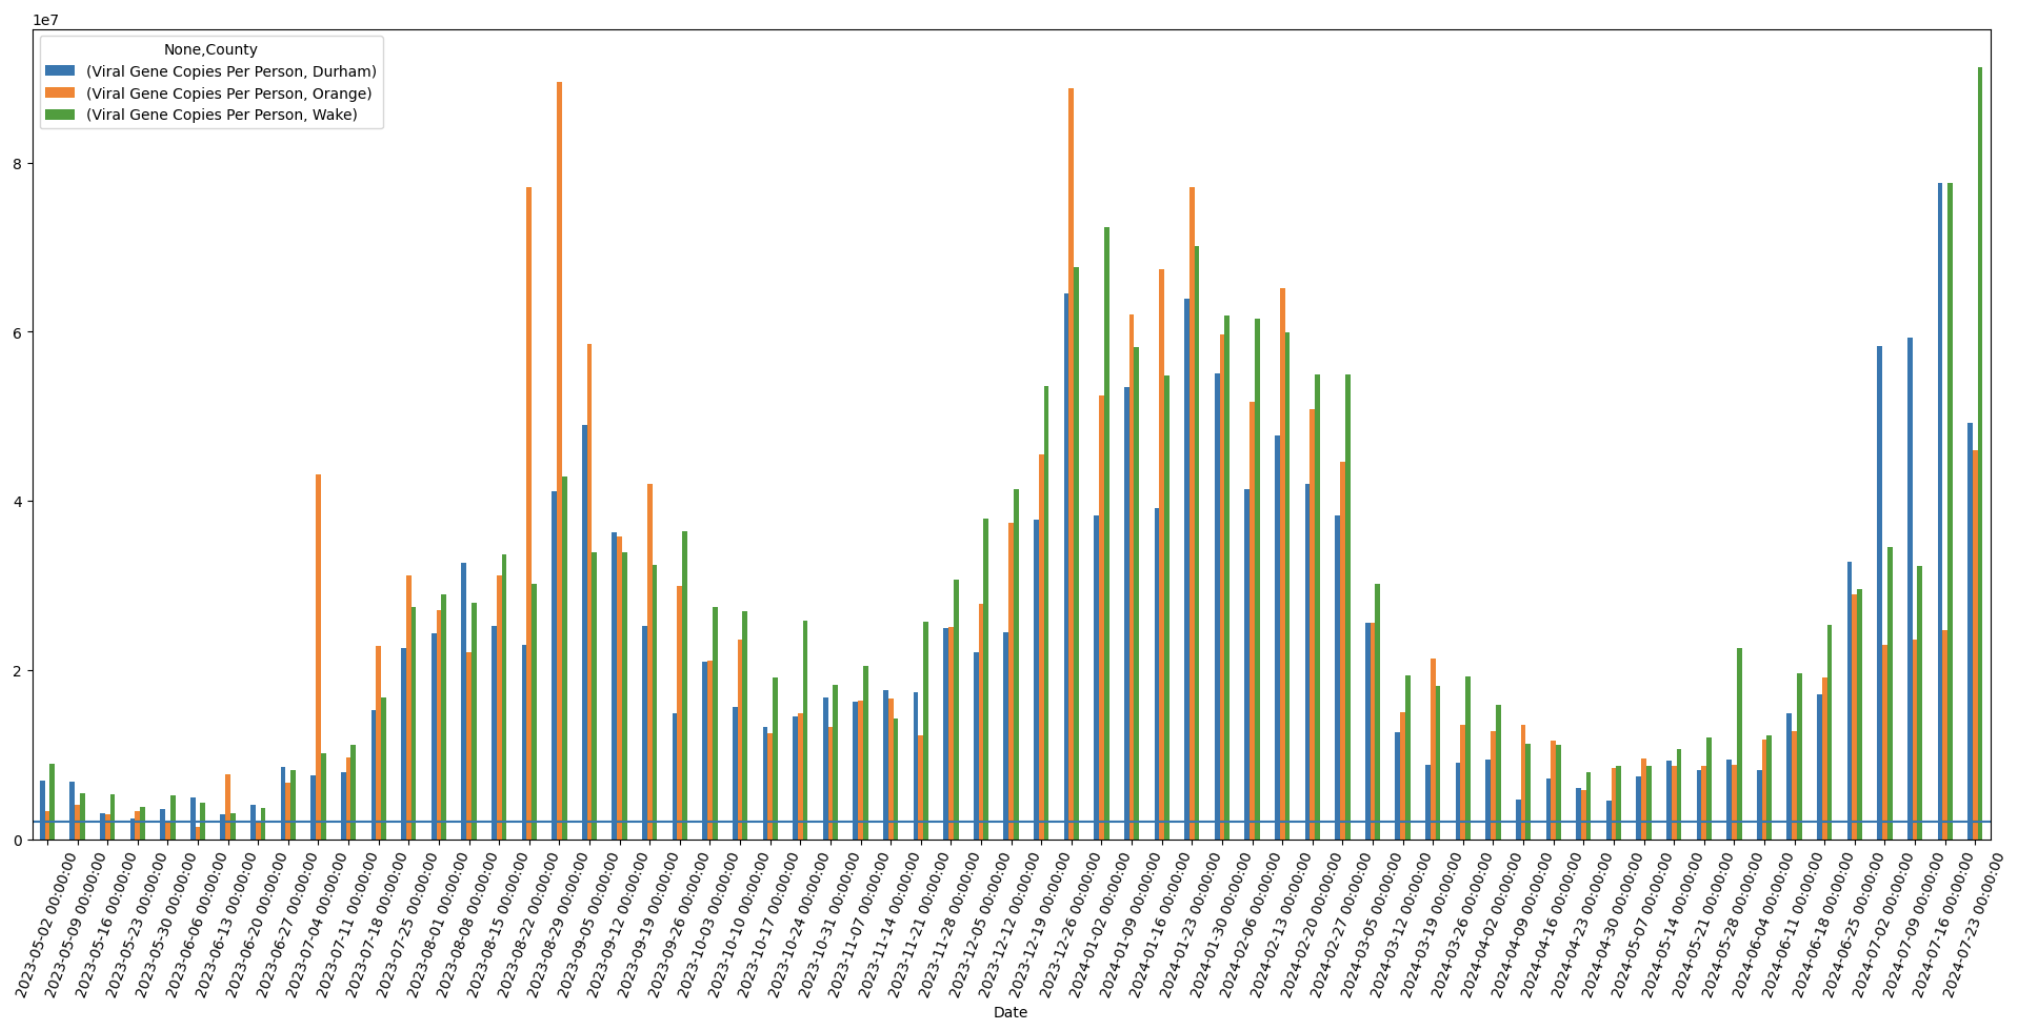
A multi-colored bar chart showing the Covid-19 wastewater surveillance data for Orange, Durham, and Wake counties in central NC. The current time period is on the far right. The lines on the far right are very tall. Taller than any of the other lines going back around 14 months.
https://dood.net/media/3b77fd6c1bc9e92bbe7c70b139beaa59035f9b28f34d8846abac34e03dc05a9d.png