GNU social JP
  • FAQ
  • Login
GNU social JPは日本のGNU socialサーバーです。
Usage/ToS/admin/test/Pleroma FE
  • Public

    • Public
    • Network
    • Groups
    • Featured
    • Popular
    • People

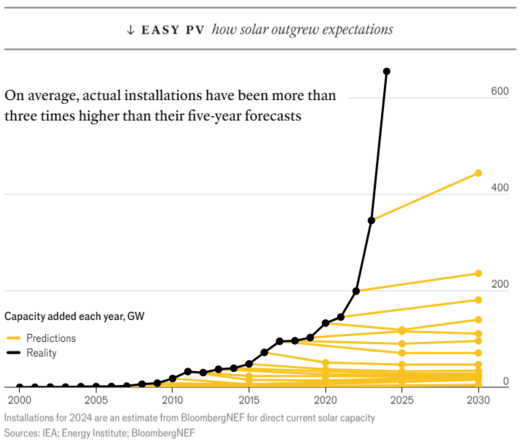
A solar power installation chart with several lines, yellow ones indicating numerous updated projections of future installs, and a black one of actual installs, outstripping every projection many times over, continuously accelerating.

Download link

https://media.mas.to/media_attachments/files/112/766/679/645/794/721/original/03a4afda92523699.png

Notices where this attachment appears

  1. Embed this notice
    Osma A 🇫🇮🇺🇦 (osma@mas.to)'s status on Friday, 12-Jul-2024 01:02:44 JST Osma A 🇫🇮🇺🇦 Osma A 🇫🇮🇺🇦

    This chart, in its various iterations, will never cease to amaze me. Energy analysts have failed to correctly forecast solar installation scale and acceleration for many decades and never seem to learn that a linear projection doesn't work for an accelerating development.
    @gwagner

    In conversation about 10 months ago from mas.to permalink
  • Help
  • About
  • FAQ
  • TOS
  • Privacy
  • Source
  • Version
  • Contact

GNU social JP is a social network, courtesy of GNU social JP管理人. It runs on GNU social, version 2.0.2-dev, available under the GNU Affero General Public License.

Creative Commons Attribution 3.0 All GNU social JP content and data are available under the Creative Commons Attribution 3.0 license.