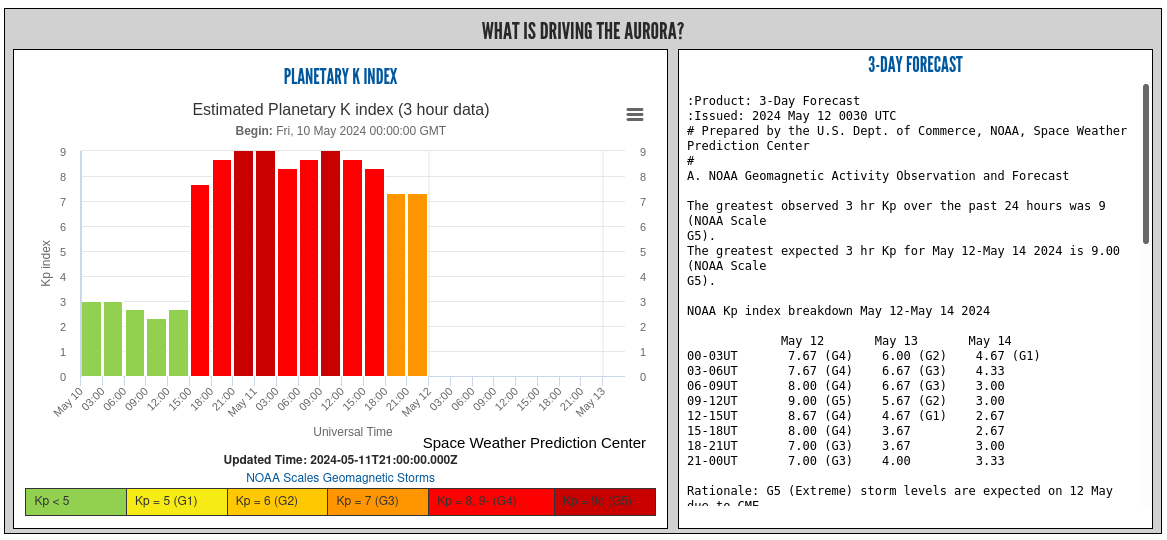
Screenshot from NOAA site showing recorded activity on the left and predictions on the right. Recorded activity is in graph bars at 3 hour intervals. Predictions are in text at 3 hour intervals for 3 days.
https://cdn.masto.host/rustedneuroncom/media_attachments/files/112/425/456/381/565/668/original/c2b41775e72d47a2.png