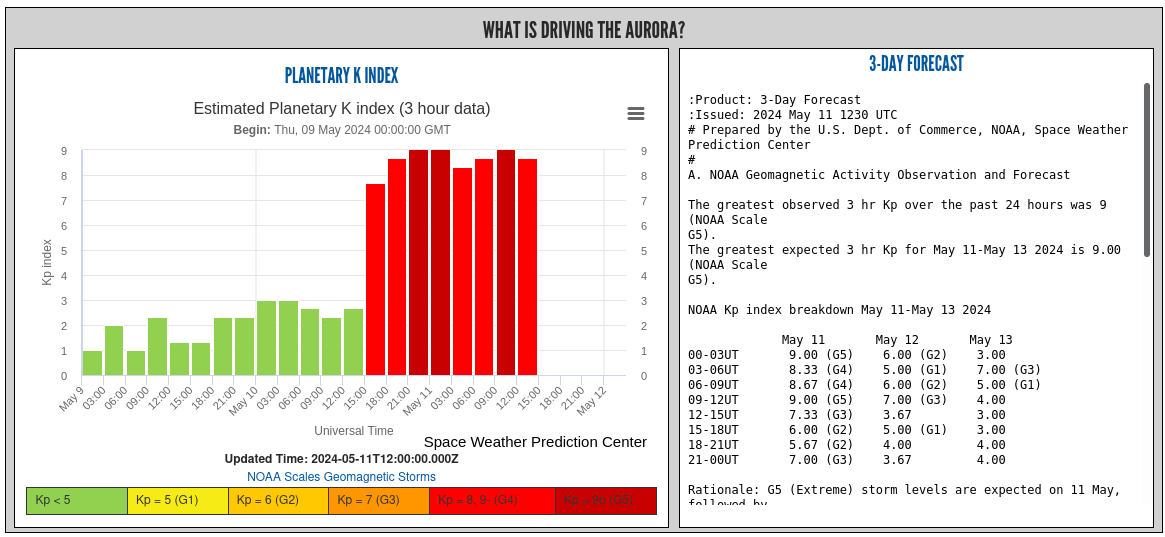
Screenshot from NOAA site showing recorded activity on the left and predictions on the right. Recorded activity is in graph bars at 3 hour intervals. Predictions are in text at 3 hour intervals for 3 days.
https://cdn.masto.host/rustedneuroncom/media_attachments/files/112/423/703/803/521/006/original/cba59f36514ce3c3.png