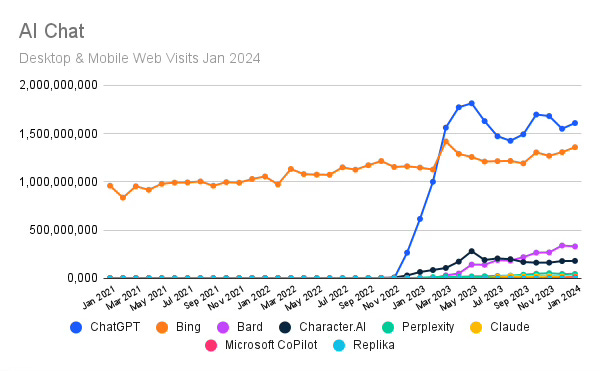
Line chart showing "Desktop & Mobile Web Visits Jan 2024" on the Y axis, date on the X axis. ChatGPT, in a Blue line, shows a sudden growth from November 2022 up to May 2023, when it reached its peak. In the Northern hemisphere summer it dropped, then it rose in September-November (still below the May peak), and it has sort of flatlined.
https://cdn.masto.host/socialjuanluspace/media_attachments/files/111/958/895/085/609/239/original/08a68b2ee49c44ba.png