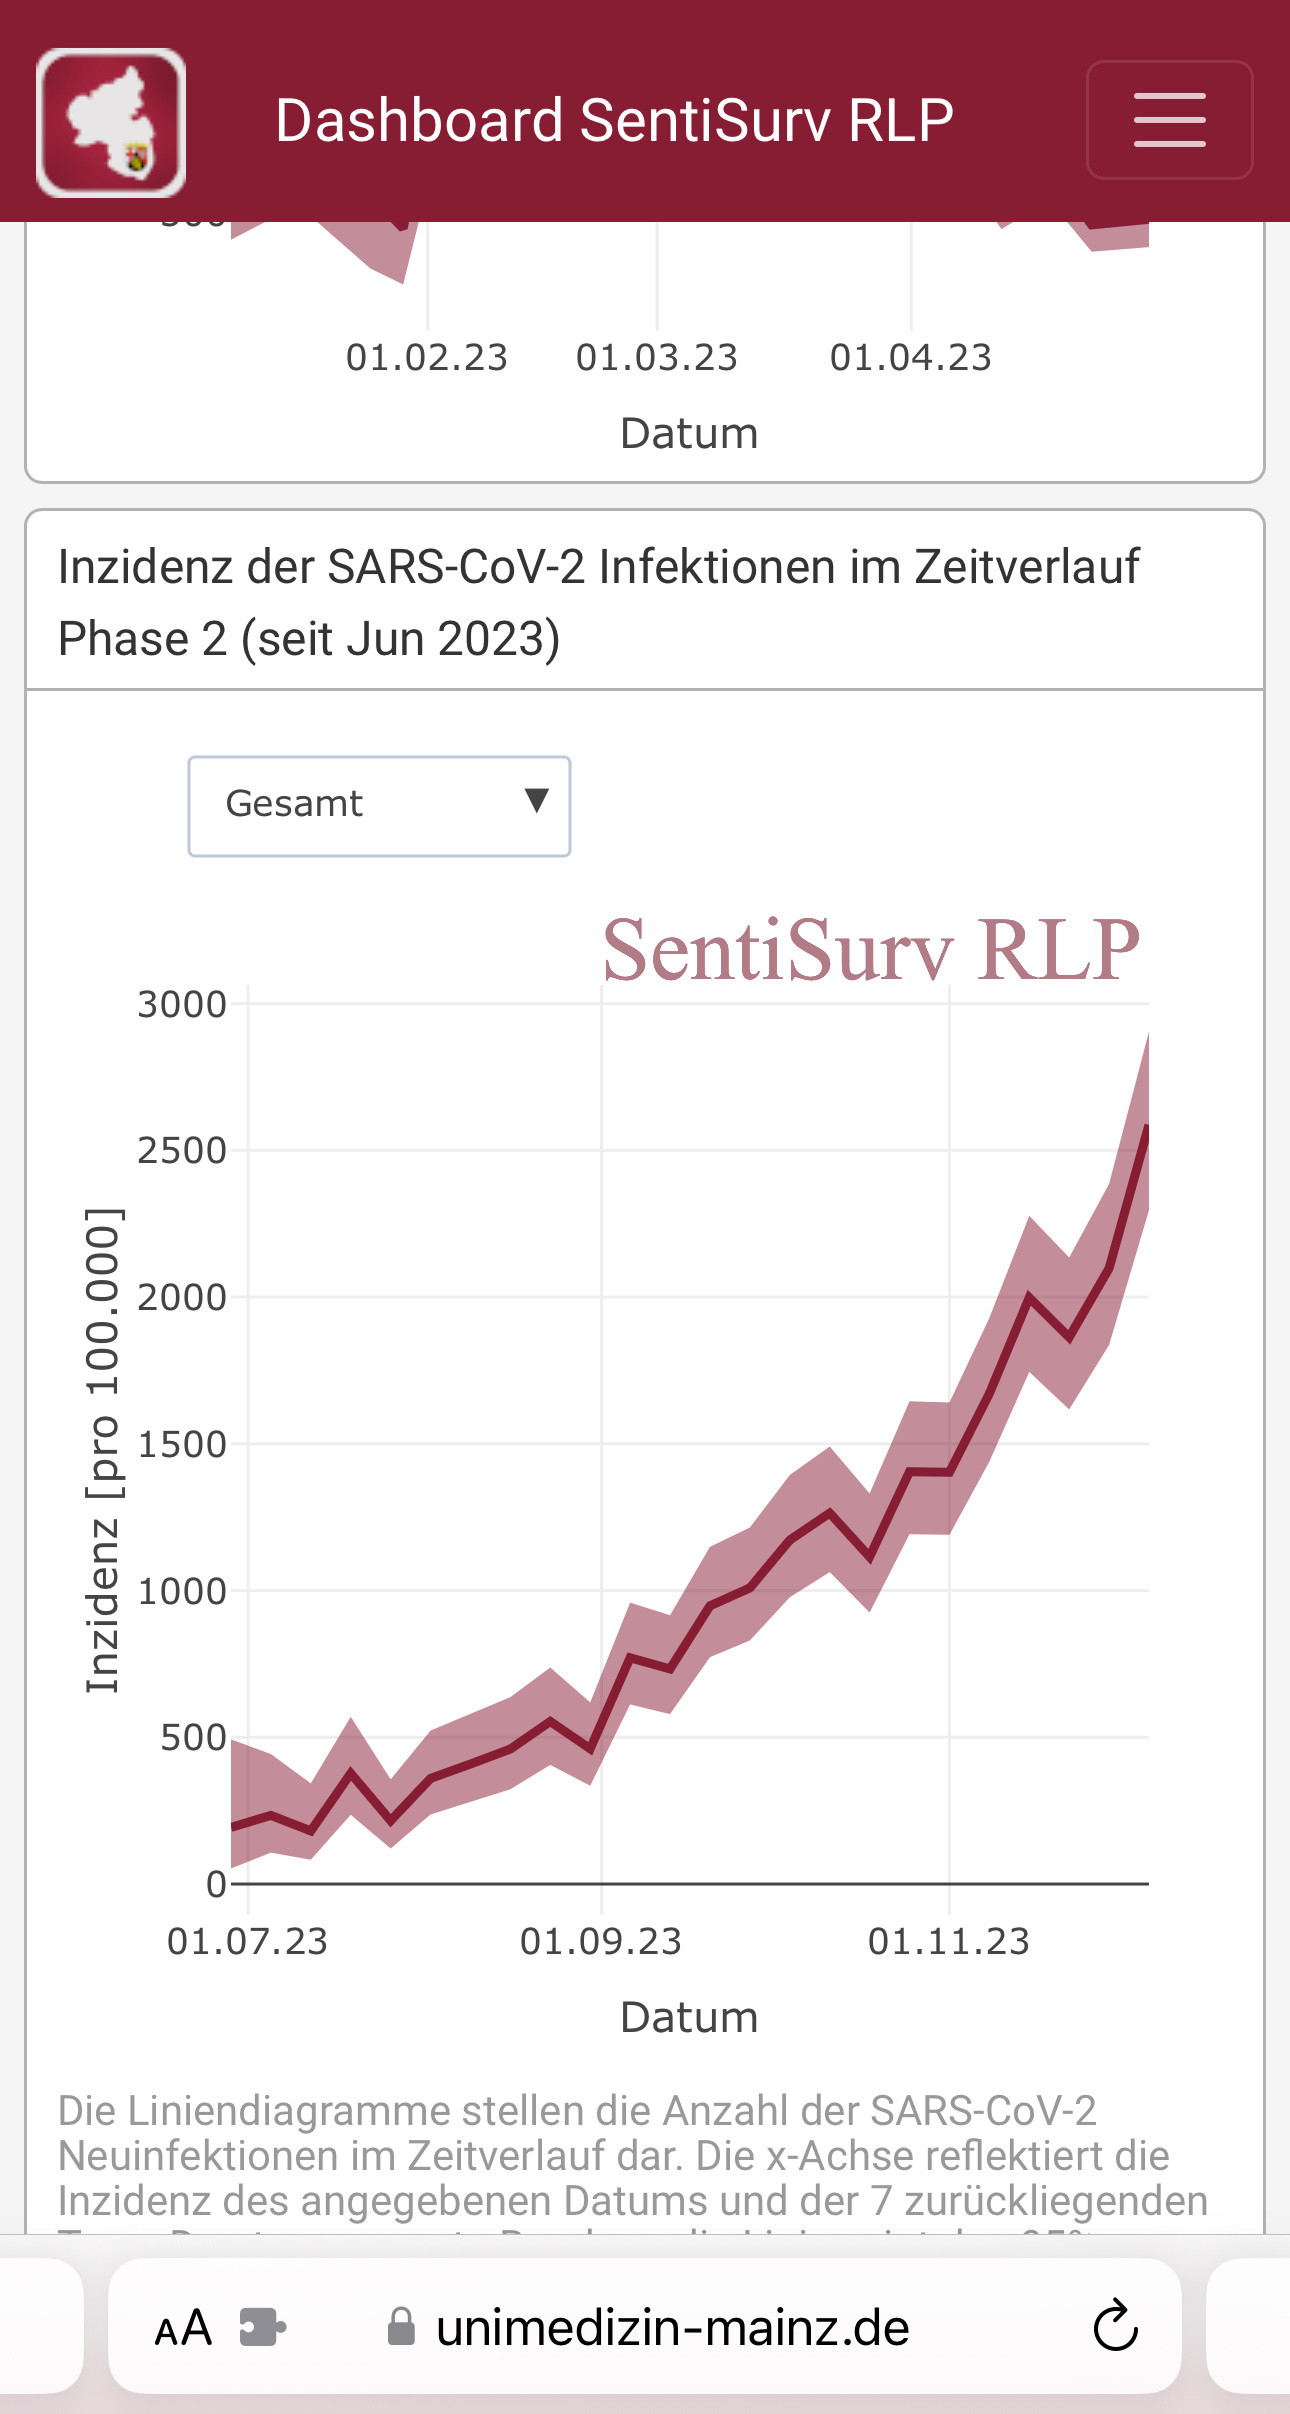
Graph of Covid incidence from a German sentinel study starting at July 1st. It starts at a 200 incidence and then goes up, picking up more speed. September 1st about 400 incidence, November 1st about 1400, December 6, the latest weekly update: 2587. it shows a confidence interval which for December 6 is 2296 to 2905.
https://cdn.masto.host/yatilsocial/media_attachments/files/111/543/747/651/604/537/original/ee453024e0e48927.jpeg