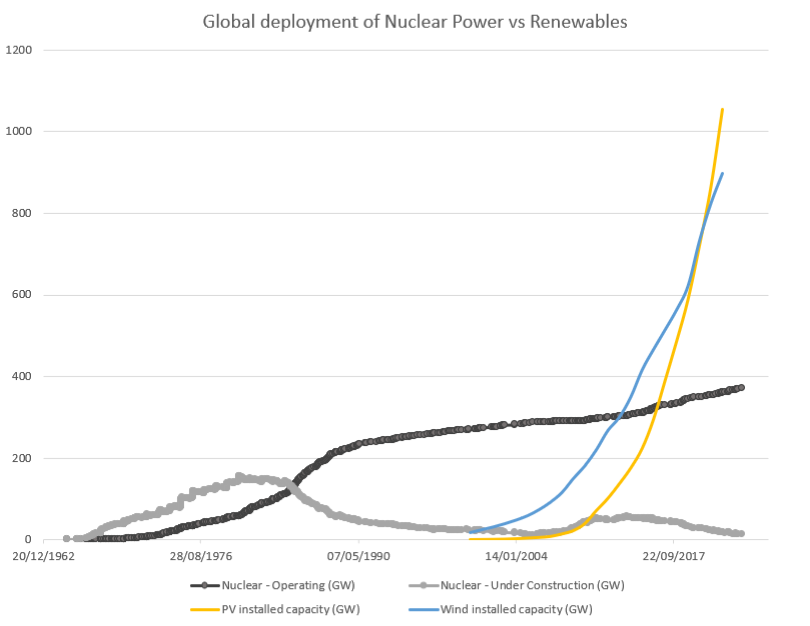
A chart showing the growth of nuclear energy from 1965 to the present, which shows growth stagnating and declining in the 80s (around when 3 mile island happened, well before Chernobyl). Meanwhile, wind and solar start in the 2000s and follow an exponential growth which quickly overtakes the total nuclear installed capacity.
https://media.mas.to/masto-public/media_attachments/files/111/510/489/176/817/581/original/89702e65b21eb294.png